

· 21 min read
30+ AI SEO Statistics for 2026: Data on AI Overviews, ChatGPT & GEO
30+ sourced AI SEO stats for 2026: AI Overviews reach 2B users, organic CTR drops 61% where they appear, and AI traffic converts up to 23x better. See the data.
AI Overviews appeared on 61.43% of US Google results in Aug 2026, up from 5.93% in Sep 2024 (DataForSEO panel). See clicks, CTR, triggers and citations.

Emre Elbeyoglu · Founder & CEO, SEOmator
16+ years in B2B SaaS SEO and growth
How we know this
Full method ↓ Written up by Emre Elbeyoglu
Google AI Overviews appeared on 61.43% of US Google results pages in August 2026, up from 5.93% in September 2024, according to DataForSEO's 20M-keyword monthly panel. Where one appears, AI Overview citations take an estimated 42–45% of clicks and the #1 organic result 21–24%, against 33–38% where none appears.
These AI Overview statistics come from DataForSEO's Search Insider: 2026 Edition (October 2026), from our own analysis of Cloudflare Radar's crawler data through October 2026, and from the published pages of Pew Research Center, Seer Interactive and Google, plus Comscore's report as covered by Search Engine Land. Every figure carries its sample and its window, because the panels disagree on level and agree on direction.
AI Overviews appeared on 61.43% of US Google results pages in August 2026, up from 5.93% in September 2024, in DataForSEO's monthly panel of 20M keywords. That is 10.36 times the starting rate and a gain of 55.5 percentage points between September 2024 and August 2026, which is where the "10x" in this page's title comes from.
The level depends on whose panel you read, so treat it as a range. DataForSEO's own quarterly panel, which keeps keywords with 100+ monthly searches, read 53.39% for Q3 2026 (to 14 September), and its June to September 2026 keyword dataset read 56.67% across industries. Comscore's Q2 2026 AI Intelligence Report put the rate at 39.4% of US desktop searches in June 2026, up from 25.8% in July 2025, as Search Engine Land reported. Google's own AI Overview for "ai overview statistics" answered "roughly 48% to 50% of US Google search queries as of 2026" when we checked it on 17 November 2026.
The line above is DataForSEO's monthly series, and the full table sits in the next section. Pew Research Center's browsing panel gives an earlier, separate reading: 18% of 68,879 Google searches that 900 US adults made in March 2025 produced an AI summary when Pew re-ran them on 7–17 April 2025. DataForSEO's panel read 14.67% in March 2025.
Reach is now global. Google said AI Overviews had over 2 billion monthly users across more than 200 countries and territories and 40 languages in its Q2 2025 earnings remarks of 23 July 2025, and that they drive "over 10% more queries globally for the types of queries that show them". AI Mode, Google's separate chat-style search, is a different surface with its own answers; our AI Mode checker shows what it returns for a query.
AI Overviews grew in steps, not in a straight line. The five largest monthly jumps in DataForSEO's US panel were June 2025 (+7.66 points), October 2025 (+7.57), July 2026 (+6.94), March 2025 (+6.83) and September 2025 (+5.49). The other months mostly rose by smaller amounts, and the rate stayed between 41.81% and 45.00% from October 2025 to April 2026.
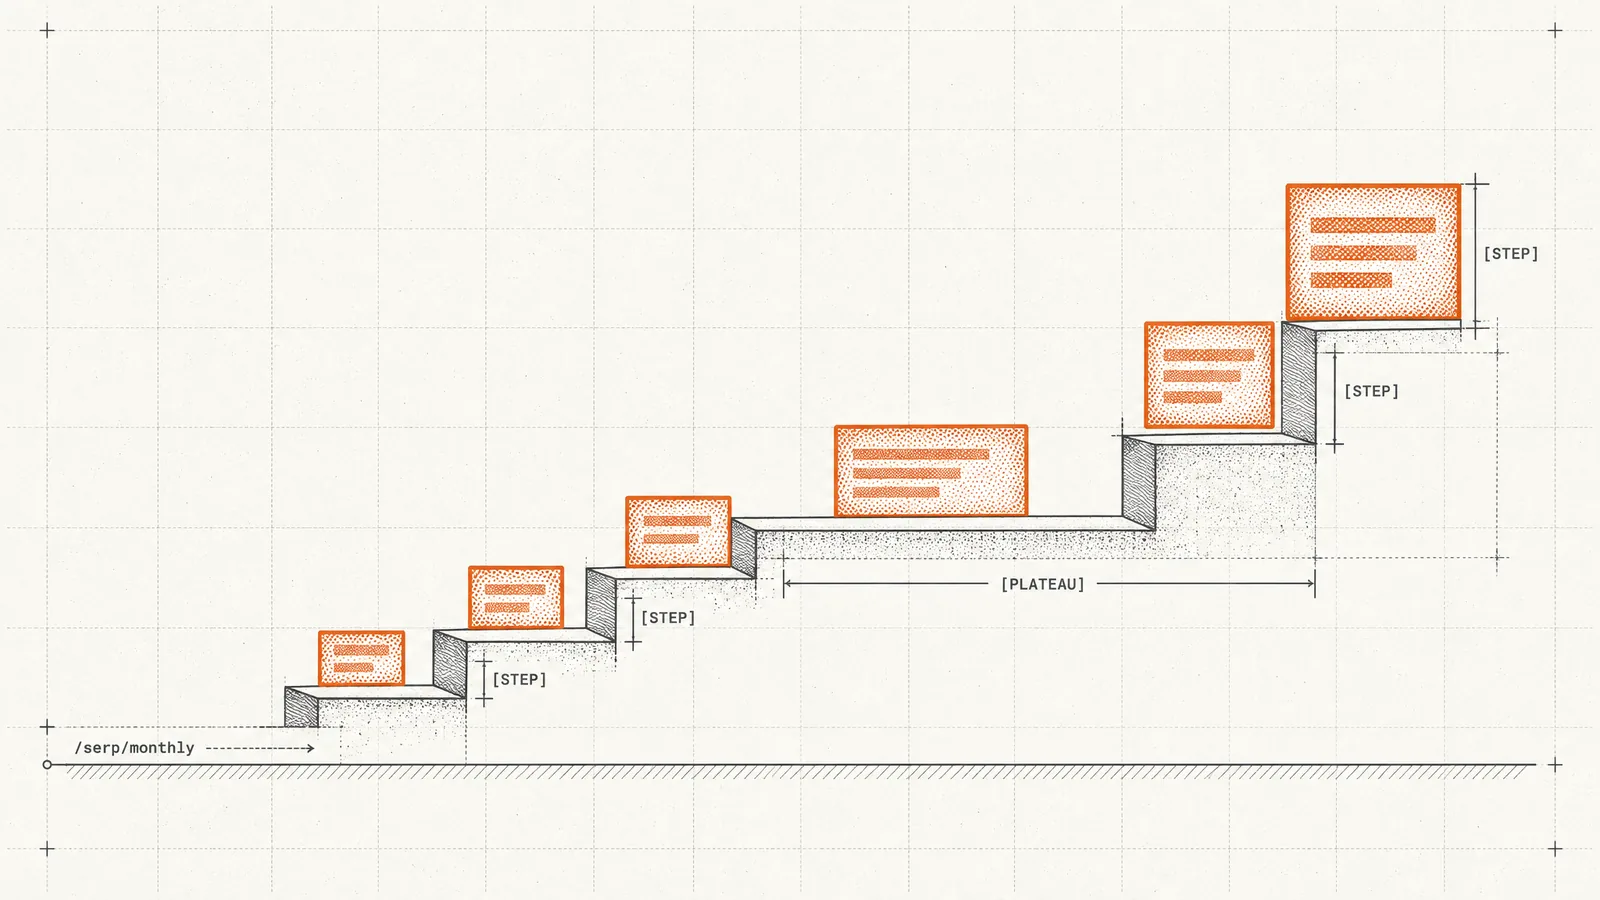
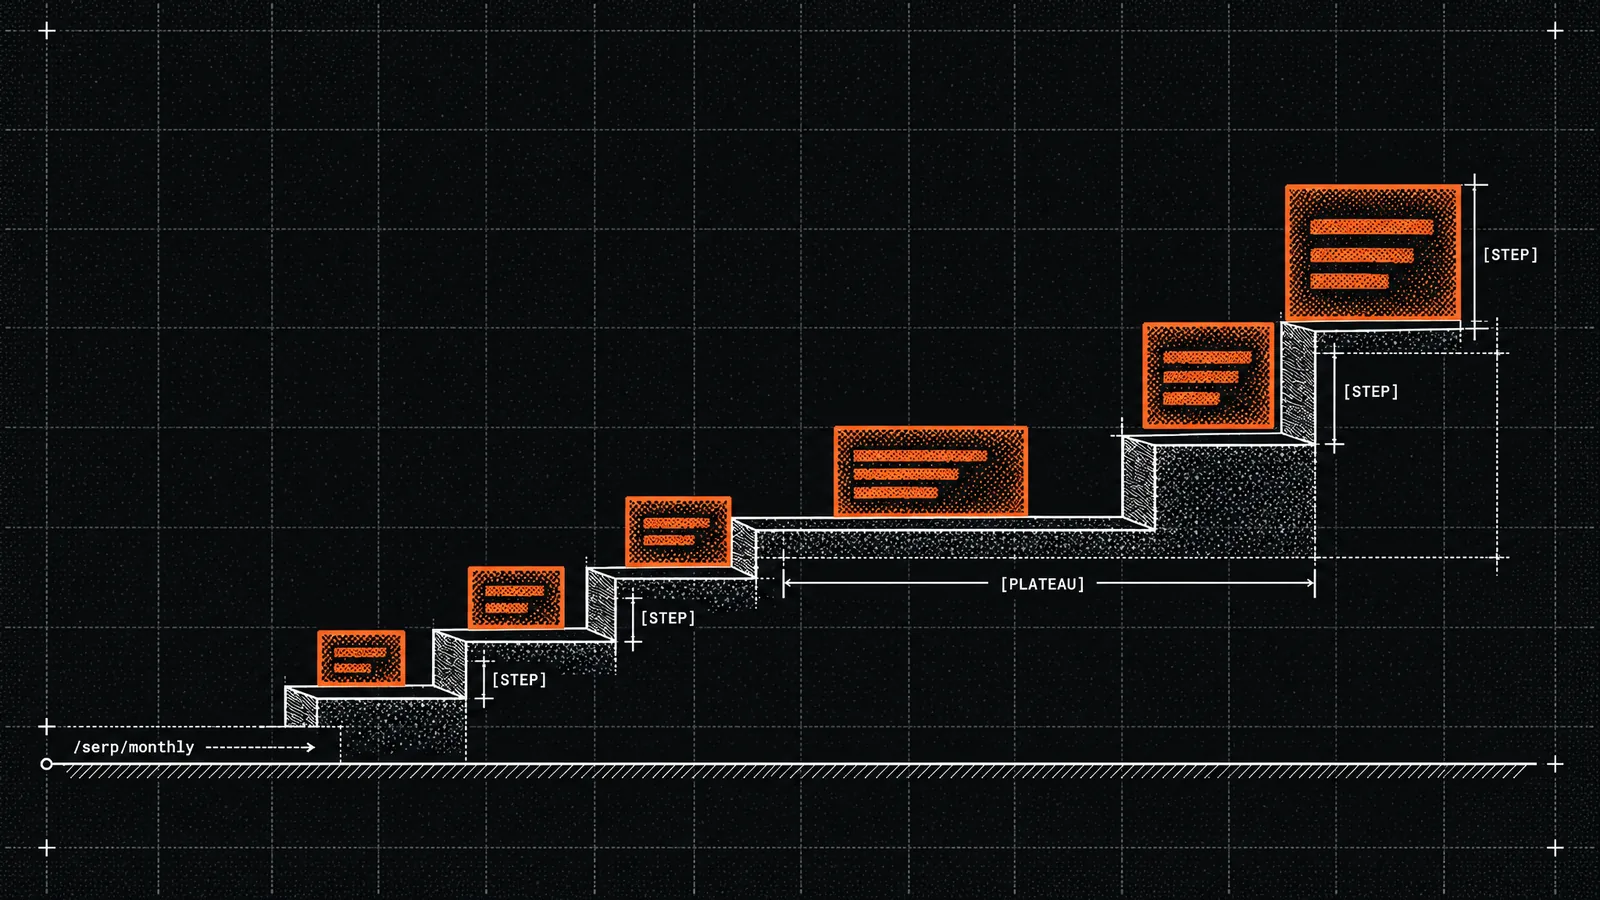
Then it moved again: from 45.00% in April 2026 to 61.43% in August 2026, a gain of 16.43 points in four months. The rate fell in five of the 23 month-to-month moves, by 0.33 to 1.95 points, the largest in November 2025. The table gives every month, with the four other SERP features the panel tracked.
| Month | AI Overviews | Featured snippets | Videos | Discussions and forums | Local packs |
|---|---|---|---|---|---|
| Sep 2024 | 5.93% | 8.96% | 9.67% | 21.13% | 19.98% |
| Oct 2024 | 6.81% | 9.52% | 10.78% | 23.07% | 20.11% |
| Nov 2024 | 8.34% | 8.81% | 10.94% | 24.10% | 20.31% |
| Dec 2024 | 9.09% | 7.92% | 10.02% | 24.93% | 19.89% |
| Jan 2025 | 8.17% | 7.85% | 8.27% | 21.97% | 21.02% |
| Feb 2025 | 7.84% | 7.45% | 8.06% | 14.67% | 21.56% |
| Mar 2025 | 14.67% | 6.39% | 8.40% | 19.64% | 20.41% |
| Apr 2025 | 17.63% | 5.36% | 6.69% | 15.61% | 17.51% |
| May 2025 | 22.61% | 5.03% | 6.18% | 18.02% | 18.61% |
| Jun 2025 | 30.27% | 4.03% | 6.01% | 17.56% | 19.40% |
| Jul 2025 | 31.33% | 2.18% | 4.84% | 18.62% | 18.09% |
| Aug 2025 | 30.70% | 1.92% | 5.85% | 16.11% | 20.50% |
| Sep 2025 | 36.19% | 1.52% | 18.38% | 15.96% | 19.32% |
| Oct 2025 | 43.76% | 1.47% | 31.05% | 14.36% | 11.47% |
| Nov 2025 | 41.81% | 1.78% | 28.67% | 14.29% | 12.32% |
| Dec 2025 | 42.57% | 1.70% | 28.35% | 13.13% | 16.54% |
| Jan 2026 | 42.09% | 1.77% | 29.21% | 13.19% | 17.24% |
| Feb 2026 | 42.79% | 1.57% | 25.32% | 13.11% | 26.76% |
| Mar 2026 | 43.38% | 1.32% | 24.65% | 13.58% | 26.94% |
| Apr 2026 | 45.00% | 1.04% | 24.93% | 17.02% | 25.98% |
| May 2026 | 49.57% | 1.12% | 26.58% | 18.01% | 26.01% |
| Jun 2026 | 53.08% | 1.06% | 26.27% | 11.95% | 26.34% |
| Jul 2026 | 60.02% | 0.96% | 23.51% | 10.55% | 24.46% |
| Aug 2026 | 61.43% | 0.44% | 19.98% | 7.42% | 25.99% |
Source: DataForSEO, Search Insider: 2026 Edition (October 2026), table A4: share of results pages showing each feature, historical Google SERPs, monthly panel of 20M keywords, US English, September 2024 to August 2026.
The data shows when the rate moved but not why, and DataForSEO's report names no cause for any single month. My reading for planning: work from the current level rather than projecting the trend line. A rate that stayed within 41.81–45.00% for seven months and then rose 36.5% in four can move again without warning, so a keyword plan built on last quarter's Overview count is already out of date.
Featured snippets almost disappeared. They showed on 8.96% of US results pages in September 2024 and on 0.44% in August 2026, a 95.1% fall to about one-twentieth of the starting rate. AI Overviews passed featured snippets in December 2024 (9.09% against 7.92%) and have stayed ahead in every month since.
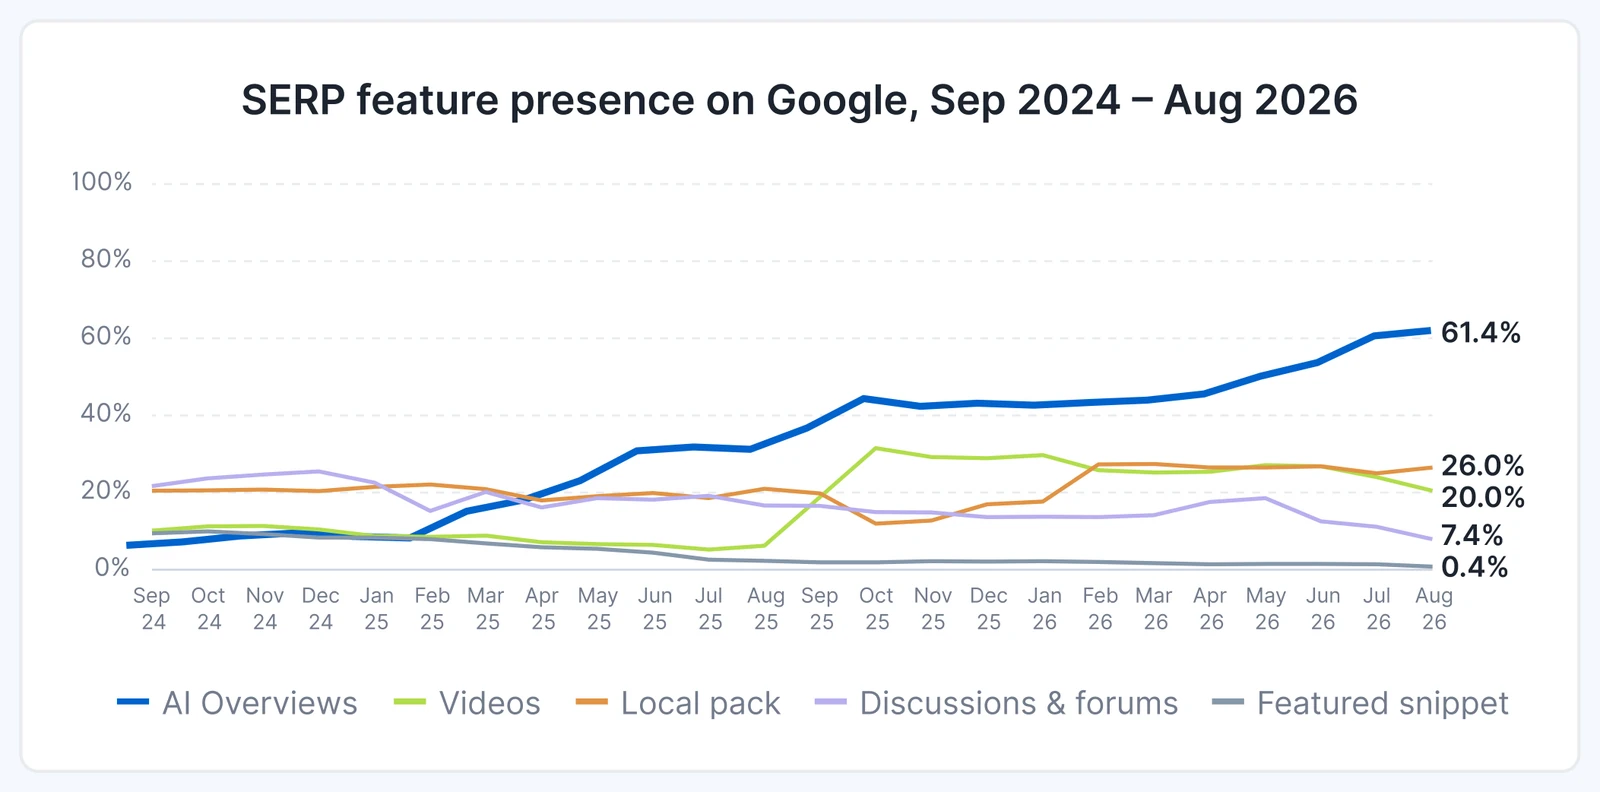
The other features moved in different directions over the same period:
| SERP feature | Sep 2024 | Aug 2026 | Change |
|---|---|---|---|
| AI Overviews | 5.93% | 61.43% | +935.9% |
| Featured snippets | 8.96% | 0.44% | −95.1% |
| Videos | 9.67% | 19.98% | +106.6% |
| Discussions and forums | 21.13% | 7.42% | −64.9% |
| Local packs | 19.98% | 25.99% | +30.1% |
Source: DataForSEO, Search Insider: 2026 Edition, table A4, monthly panel of 20M keywords, US English. Change is relative, computed from the table's percentages.
A falling forum box does not mean Reddit lost ground in Google. DataForSEO's report, in a separate table, still finds Reddit in roughly one-third of the results pages it analysed, and Reddit is the second most-cited domain in AI Overviews (see below). The forum feature and the forum site are measured separately.
AI Overview citations take an estimated 42.2% to 44.8% of clicks on results pages that show an Overview, depending on search intent, in DataForSEO's clickstream model of 7 September 2026. The model gives the #1 organic result 20.7–24.1% of clicks on results pages with an Overview, against 33.4–37.6% on pages without one.
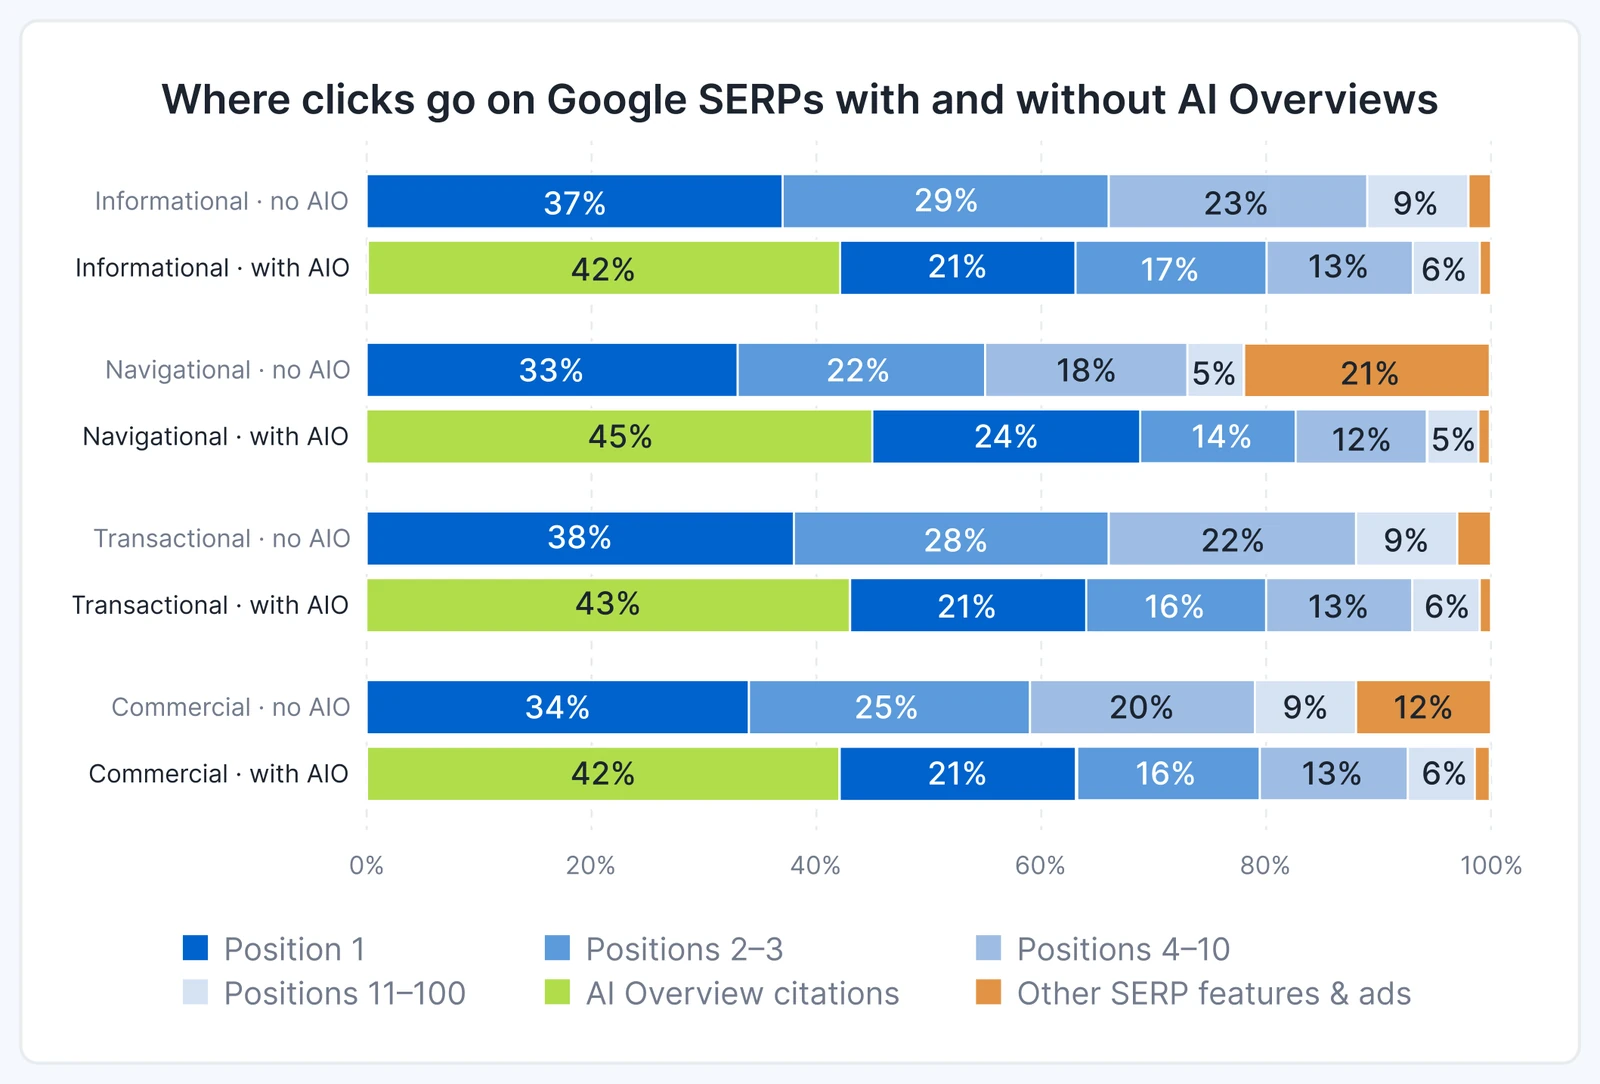
| Search intent | Overview | AI Overview citations | Position 1 | Positions 2–3 | Positions 4–10 | Positions 11–100 | Other features and ads |
|---|---|---|---|---|---|---|---|
| Informational | Without | – | 37.1% | 28.8% | 22.9% | 9.2% | 2.0% |
| Informational | With | 42.4% | 20.7% | 16.7% | 13.3% | 6.5% | 0.4% |
| Navigational | Without | – | 33.4% | 22.2% | 18.0% | 5.3% | 21.1% |
| Navigational | With | 44.8% | 24.1% | 13.8% | 11.8% | 4.8% | 0.9% |
| Transactional | Without | – | 37.6% | 27.5% | 22.3% | 9.1% | 3.4% |
| Transactional | With | 43.0% | 21.4% | 16.3% | 13.0% | 5.7% | 0.7% |
| Commercial | Without | – | 33.8% | 24.9% | 20.3% | 9.3% | 11.8% |
| Commercial | With | 42.2% | 21.1% | 16.0% | 13.0% | 6.5% | 1.3% |
Source: DataForSEO, Search Insider: 2026 Edition, table A3: estimated share of clicks by result type, Google SERP snapshot of 7 September 2026, US English, 188.86M keywords with top-10 organic results; clickstream-based estimates that exclude zero-click searches. Positions 2–3 add the table's positions 2 and 3; pages without an Overview have no Overview citations.
These are modelled estimates rather than measured clicks. The model spreads the clicks that happen across result types and leaves out searches that end with no click at all, so it shows how clicks divide between results and says nothing about how many there are.
Inside that model the top 10's share is 32.5% to 42.9% lower where an Overview shows. Without an Overview the top 10 organic results take 73.6–88.8% of estimated clicks by intent; with one they take 49.7–50.7%, about half. Position 1 loses 9.3 points on navigational queries and 16.4 points on informational ones, a 27.8% to 44.2% relative drop. Positions 2 to 10 together lose 35.8% to 42.0% of their share.
Measured behaviour points the same way. In Pew Research Center's browsing panel of March 2025, users clicked a traditional search result on 8% of visits to a results page with an AI summary and on 15% without one. They clicked a link inside the summary on 1% of those visits, and they ended their browsing session on 26% of pages with a summary against 16% without.
Desktop click-through rate at position 1 fell from 17.83% in September 2025 to 7.43% in August 2026, a 58.4% relative drop, across the 2K+ websites in DataForSEO's organic search dataset. Mobile position 1 fell far less, from 25.17% to 20.80% (−17.4%), after a low of 12.96% in February 2026.
The desktop drop came in one step. Position 1 on desktop read 15.18% in February 2026 and 7.94% in March 2026, and it has stayed between 7.21% and 9.27% since. Mobile moved the other way that spring, recovering from 12.96% in February to 22.49% in May.
| Position | Desktop, Sep 2025 | Desktop, Aug 2026 | Mobile, Sep 2025 | Mobile, Aug 2026 |
|---|---|---|---|---|
| 1 | 17.83% | 7.43% | 25.17% | 20.80% |
| 2 | 15.27% | 3.07% | 7.99% | 8.52% |
| 3 | 3.43% | 0.58% | 5.98% | 4.77% |
| 4–10 | 1.23% | 0.60% | 3.08% | 1.93% |
Source: DataForSEO, Search Insider: 2026 Edition, table A2: monthly organic CTR by position and device, anonymized organic search performance data from 2K+ websites with at least 1,000 impressions a month, US searches, September 2025 to August 2026.
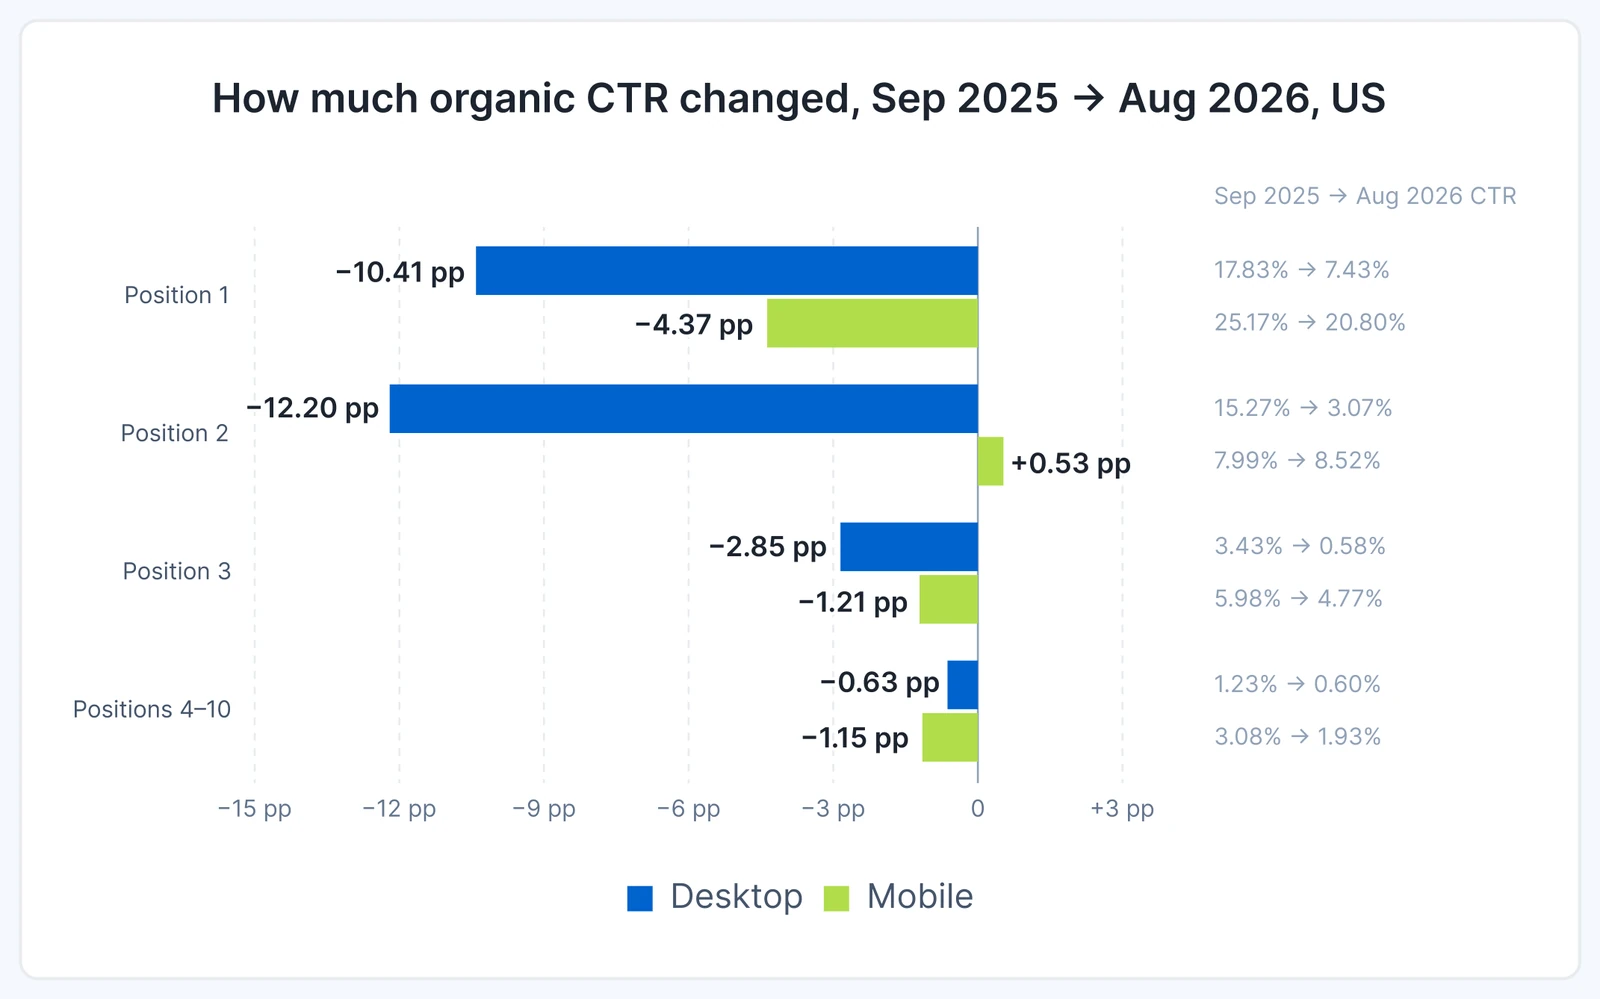
In percentage points, desktop position 1 lost 10.41 and desktop position 2 lost 12.20, while mobile position 1 lost 4.37 and mobile position 2 gained 0.53. Position 3 fell 2.85 points on desktop and 1.21 on mobile, and positions 4–10 fell 0.63 and 1.15.
Two caveats belong next to this table. The sample is DataForSEO's anonymized, aggregated organic performance data from 2K+ websites, not the whole web, and desktop position 2's starting month is an outlier: 15.27% in September 2025 against 5.37% in October 2025, so its fall looks larger than it is. Compare desktop position 2 from October 2025 (5.37% to 3.07%) if you quote it. Our SEO benchmarks report sets click-through rates like these against crawl and Core Web Vitals benchmarks.
Seer Interactive's April 2026 update, across 53 brands, 5.47M queries and 2.43 billion organic impressions from January 2025 to February 2026, shows the decline reversing in early 2026. Organic CTR on queries with an AI Overview fell to 1.3% in December 2025, then recovered to 2.4% in February 2026. CTR on queries without an Overview rose from 2.8% in January 2025 to 3.8% in February 2026. Seer labels each query by whether its most recent results page showed an Overview and applies that label to every month, so these are cohorts, not month-by-month Overview status.
Informational searches trigger AI Overviews most: 70.44% of informational results pages showed one in Q3 2026, against 51.35% of commercial, 34.03% of navigational and 28.64% of transactional pages, in DataForSEO's quarterly panel. Q3 2026 is partial, to 14 September, and it carries most of the year's growth.
| Search intent | Q4 2025 | Q1 2026 | Q2 2026 | Q3 2026 (to 14 Sep) |
|---|---|---|---|---|
| Informational | 48.42% | 50.30% | 56.14% | 70.44% |
| Commercial | 26.30% | 29.33% | 32.94% | 51.35% |
| Navigational | 17.04% | 17.67% | 19.87% | 34.03% |
| Transactional | 10.82% | 12.13% | 14.89% | 28.64% |
| All intents | 32.12% | 33.94% | 37.98% | 53.39% |
Source: DataForSEO, Search Insider: 2026 Edition, table B1: AI Overview trigger rate by search intent, historical Google SERPs, quarterly panel of keywords with 100+ monthly searches (74.9M SERPs), US English, October 2025 to 14 September 2026. All-intent rates are computed from the table's SERP counts.
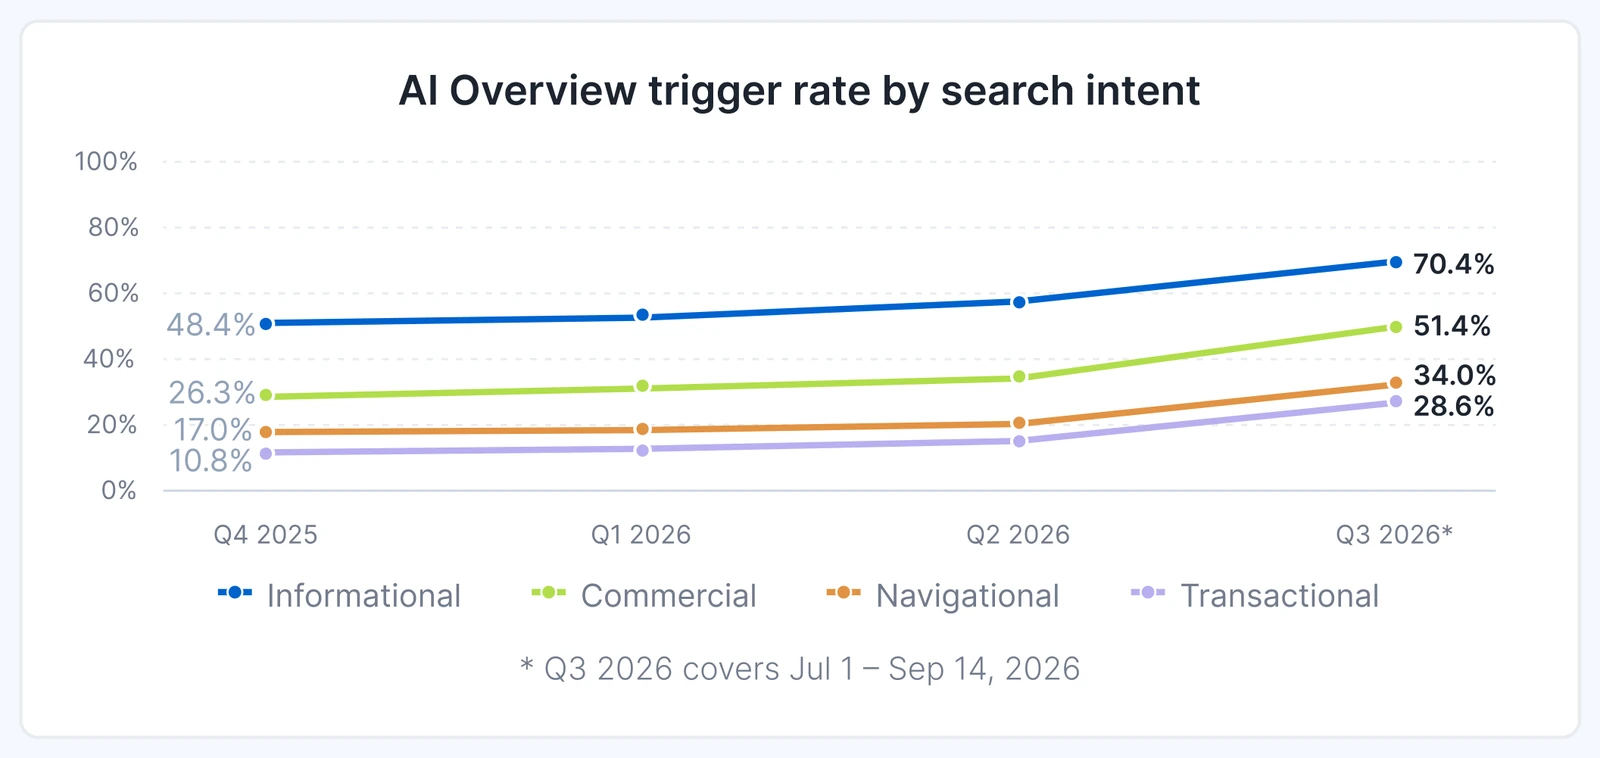
Commercial searches are the change to watch: their rate nearly doubled from 26.30% to 51.35% in three quarters. Seer Interactive's query-level cut of informational searches shows which formats are most exposed. Across 30,842 tracked informational queries, comparison queries triggered an Overview 95.4% of the time and question-format queries 85.9%; in a wider set of 49,353 queries, informational "near me" searches showed one 76.9% of the time.
By industry, Health leads at 69.68% and Real Estate trails at 22.27%, against an overall rate of 56.67% in DataForSEO's June to September 2026 keyword dataset:
| Rank | Industry | AI Overview rate |
|---|---|---|
| 1 | Health | 69.68% |
| 2 | Finance | 68.80% |
| 3 | Family & Community | 68.63% |
| 4 | Computers & Consumer Electronics | 67.34% |
| 5 | News, Media & Publications | 65.52% |
| 6 | Internet & Telecom | 63.68% |
| 7 | Food & Groceries | 62.61% |
| 8 | Law & Government | 61.07% |
| 9 | Arts & Entertainment | 58.22% |
| 10 | Beauty & Personal Care | 58.14% |
| 11 | Business & Industrial | 57.51% |
| 12 | Hobbies & Leisure | 57.12% |
| 13 | Jobs & Education | 57.08% |
| 14 | Vehicles | 55.63% |
| 15 | Sports & Fitness | 55.02% |
| 16 | Occasions & Gifts | 53.85% |
| 17 | Unclassified | 51.02% |
| 18 | Home & Garden | 49.28% |
| 19 | Travel & Tourism | 47.17% |
| 20 | Retailers & General Merchandise | 43.33% |
| 21 | Apparel | 37.48% |
| 22 | Dining & Nightlife | 29.37% |
| 23 | Real Estate | 22.27% |
Source: DataForSEO, Search Insider: 2026 Edition, table B5: AI Overview trigger rate by industry, Google SERPs and keyword metrics, 16 June to 10 September 2026, US English, 194.6M SERPs.
Keyword difficulty and cost per click change the rate less than intent does. Mid-difficulty keywords (KD 41–60) showed an Overview on 65.32% of pages, the hardest (KD 81–100) on 53.76%. Keywords with no CPC data showed the highest rate of all, 60.06%, and they make up 54.5% of that table's pages; keywords with a CPC ranged from 42.63% to 50.54%. Query length matters too: Pew found AI summaries on 8% of one- or two-word searches and 53% of searches with 10 or more words.
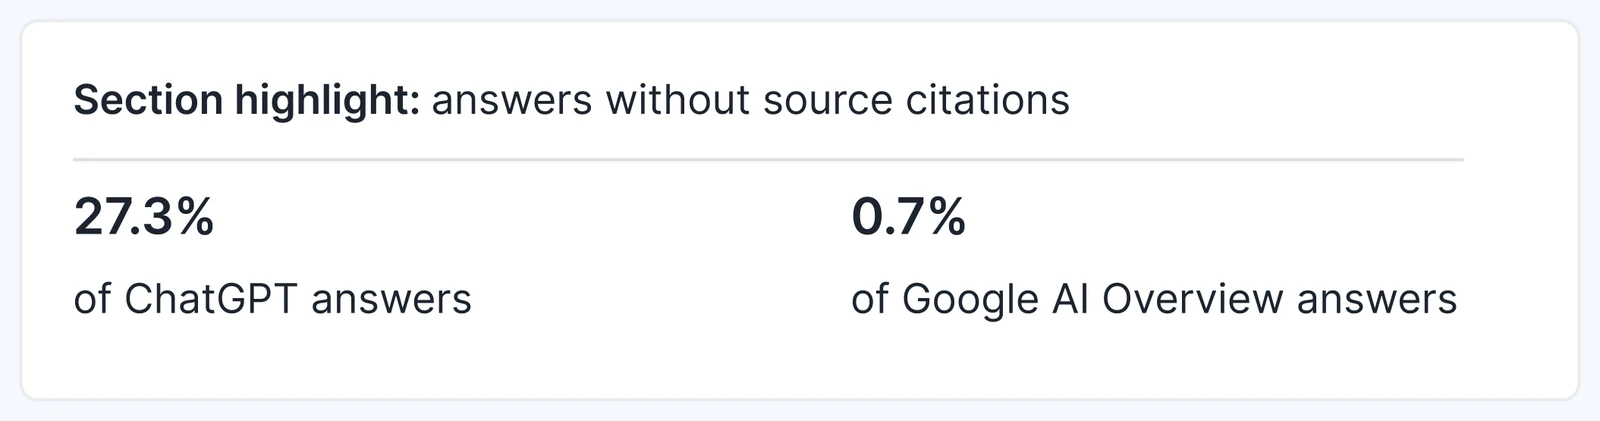
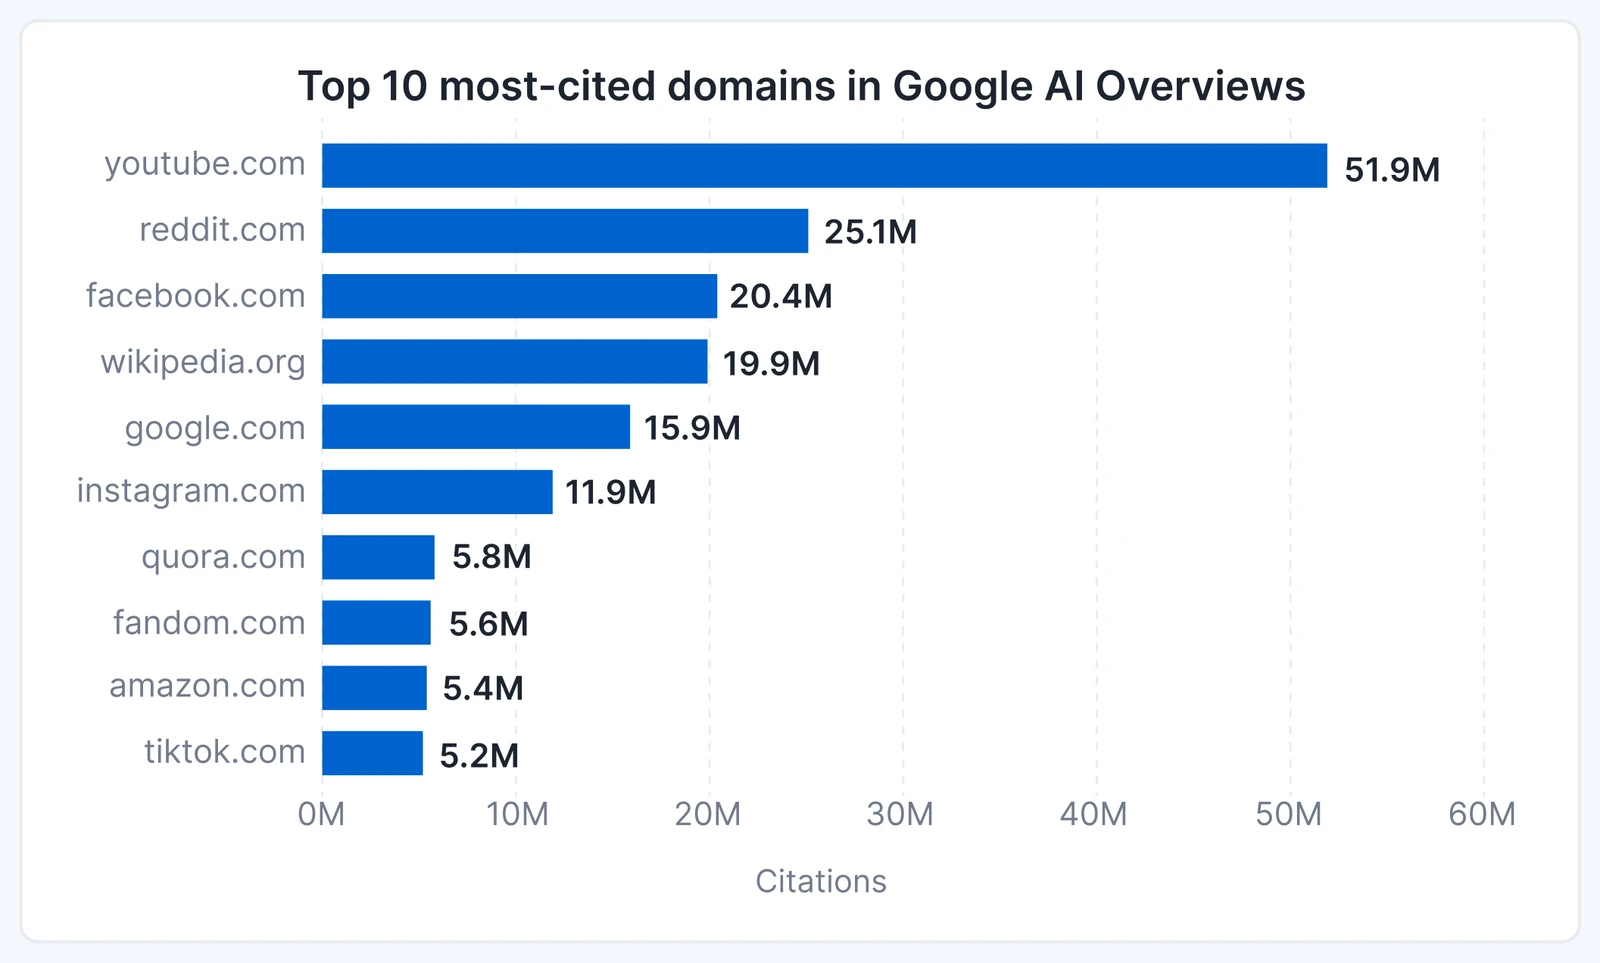
YouTube is the most-cited domain in Google AI Overviews, with 51.9 million citations, 2.07 times Reddit's 25.1 million, in DataForSEO's AI Overview dataset (snapshot of 14 September 2026). Almost every Overview cites something: only 0.7% of AI Overview answers had no source citation, against 27.3% of ChatGPT answers, in DataForSEO's separate corpora of 137.9M AI Overview and 27.5M ChatGPT answers.
| Rank | Domain | AI Overview citations |
|---|---|---|
| 1 | youtube.com | 51.9M |
| 2 | reddit.com | 25.1M |
| 3 | facebook.com | 20.4M |
| 4 | wikipedia.org | 19.9M |
| 5 | google.com | 15.9M |
| 6 | instagram.com | 11.9M |
| 7 | quora.com | 5.8M |
| 8 | fandom.com | 5.6M |
| 9 | amazon.com | 5.4M |
| 10 | tiktok.com | 5.2M |
Source: DataForSEO, Search Insider: 2026 Edition, table C3: top 30 most-cited domains in Google AI Overviews (top 10 shown), DataForSEO Google AI Overview dataset, US English, snapshot of 14 September 2026.
Other panels name the same winners. Pew found that Wikipedia, YouTube and Reddit made up 15% of the sources listed in AI summaries in March 2025, and that 6% of AI summary sources were .gov sites against 2% of standard results. Comscore found YouTube in 23% of US retail searches among the top listed AI Overview citations in June 2026, ahead of Amazon (14%), Reddit (12%) and Wikipedia (11%).
Cited sites for hard queries carry bigger link profiles. Among sites cited in AI Overviews, the median number of referring domains was 282 for keywords of difficulty 1–20 and 1,571 for difficulty 81–100, 5.6 times as many, in DataForSEO's 1% domain-hash sample with large platforms such as YouTube and Wikipedia excluded (backlinks of 30 September 2026, Overviews of 12 October 2026). That is an association, not proof that links earn citations.
Yes. On Cloudflare's network, Google made 3.76 crawl requests for every referral it sent in October 2026, against 3.79 in January 2025, in our analysis of Cloudflare Radar. DataForSEO's US panel, which ends two months earlier, shows AI Overviews rising from 8.17% of results pages in January 2025 to 61.43% in August 2026.
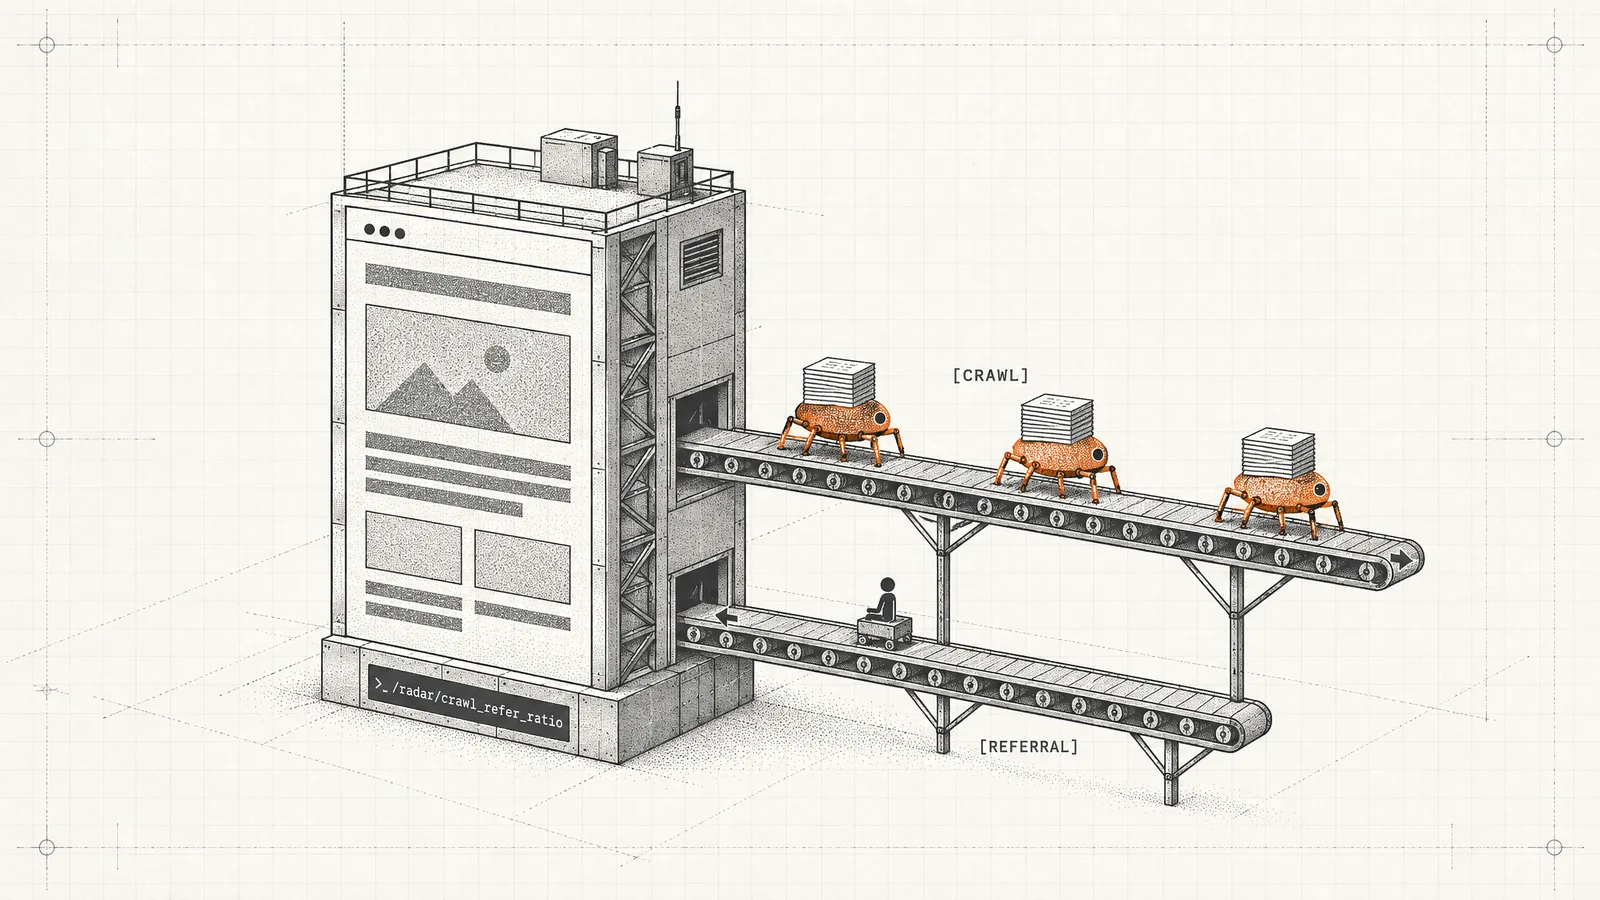

The crawl-to-refer ratio is the number of pages a platform's crawlers request for every visit its products send back to websites. A ratio of 4:1 means four crawl requests per referral.
The spring 2025 spike moved with Googlebot's crawling. Google's ratio rose to 13.91 in March, 22.36 in April and 17.25 in May 2025, and in the same months Googlebot's share of all crawler requests on Cloudflare rose from 27.42% in January to 61.80% in April. Both fell back together, the ratio to 3.82 and Googlebot's share to 26.92% by August 2025. Radar reports shares, not counts, so the data can't say how much of the spike was extra crawling and how much fewer referrals. In 2026 the ratio has stayed between 3.73 and 4.31, with a median of 3.98.
| Month | Google crawls per referral | Googlebot share of crawler requests | Google share of crawler-platform referrals |
|---|---|---|---|
| Jan 2025 | 3.79 | 27.42% | 87.72% |
| Feb 2025 | 6.49 | 35.38% | 87.61% |
| Mar 2025 | 13.91 | 50.36% | 85.42% |
| Apr 2025 | 22.36 | 61.80% | 84.18% |
| May 2025 | 17.25 | 54.96% | 80.91% |
| Jun 2025 | 12.57 | 44.64% | 81.60% |
| Jul 2025 | 5.43 | 34.43% | 80.95% |
| Aug 2025 | 3.82 | 26.92% | 81.70% |
| Sep 2025 | 5.27 | 32.17% | 80.65% |
| Oct 2025 | 5.74 | 35.83% | 80.15% |
| Nov 2025 | 6.49 | 38.64% | 81.16% |
| Dec 2025 | 4.90 | 28.66% | 81.87% |
| Jan 2026 | 3.74 | 23.81% | 81.62% |
| Feb 2026 | 4.31 | 24.37% | 84.88% |
| Mar 2026 | 4.06 | 23.46% | 87.66% |
| Apr 2026 | 4.17 | 24.05% | 87.27% |
| May 2026 | 3.93 | 22.99% | 87.93% |
| Jun 2026 | 4.02 | 20.43% | 88.51% |
| Jul 2026 | 3.76 | 20.41% | 88.10% |
| Aug 2026 | 4.17 | 21.97% | 88.57% |
| Sep 2026 | 3.73 | 23.40% | 90.48% |
| Oct 2026 | 3.76 | 23.70% | 91.25% |
Source: SEOmator analysis of Cloudflare Radar: bots/crawlers/summary/crawl_refer_ratio, bots/crawlers/summary/user_agent and bots/crawlers/summary/referer (Google's referrers grouped as google.*), no filters, one call per calendar month, January 2025 to October 2026, pulled 17 November 2026. Global traffic on Cloudflare's network.
Google also sends a larger share of the referrals Radar attributes to crawler platforms than it did before Overviews spread: 91.25% in October 2026, against 87.72% in January 2025 and a low of 80.15% in October 2025. chatgpt.com sent 0.16% in October 2026. Our crawl-to-refer report, linked above, shows from seomator.com's own analytics that ChatGPT's links stopped carrying a referrer in early October 2026, so that share undercounts ChatGPT.
These figures don't show that AI Overviews caused or prevented anything. Radar's data is global and DataForSEO's is US English; a ratio says nothing about how many visits Google sends in total; and Cloudflare sees only the sites it serves. What they do show is that Google's ratio ended where it started, and held between 3.73 and 4.31 through 2026 while Overviews spread, and that Comscore counted 77 billion US desktop searches in Q2 2026, 8% more than the 71 billion of Q2 2024. Fewer clicks per results page and more searches can both be true. The other side of the exchange, how much the AI crawlers take, is in our monthly AI crawler report.
Plan for Overviews on most informational keywords and on half of commercial ones, and measure citations next to rankings. DataForSEO's report closes with five priorities (the bold headings are its own):
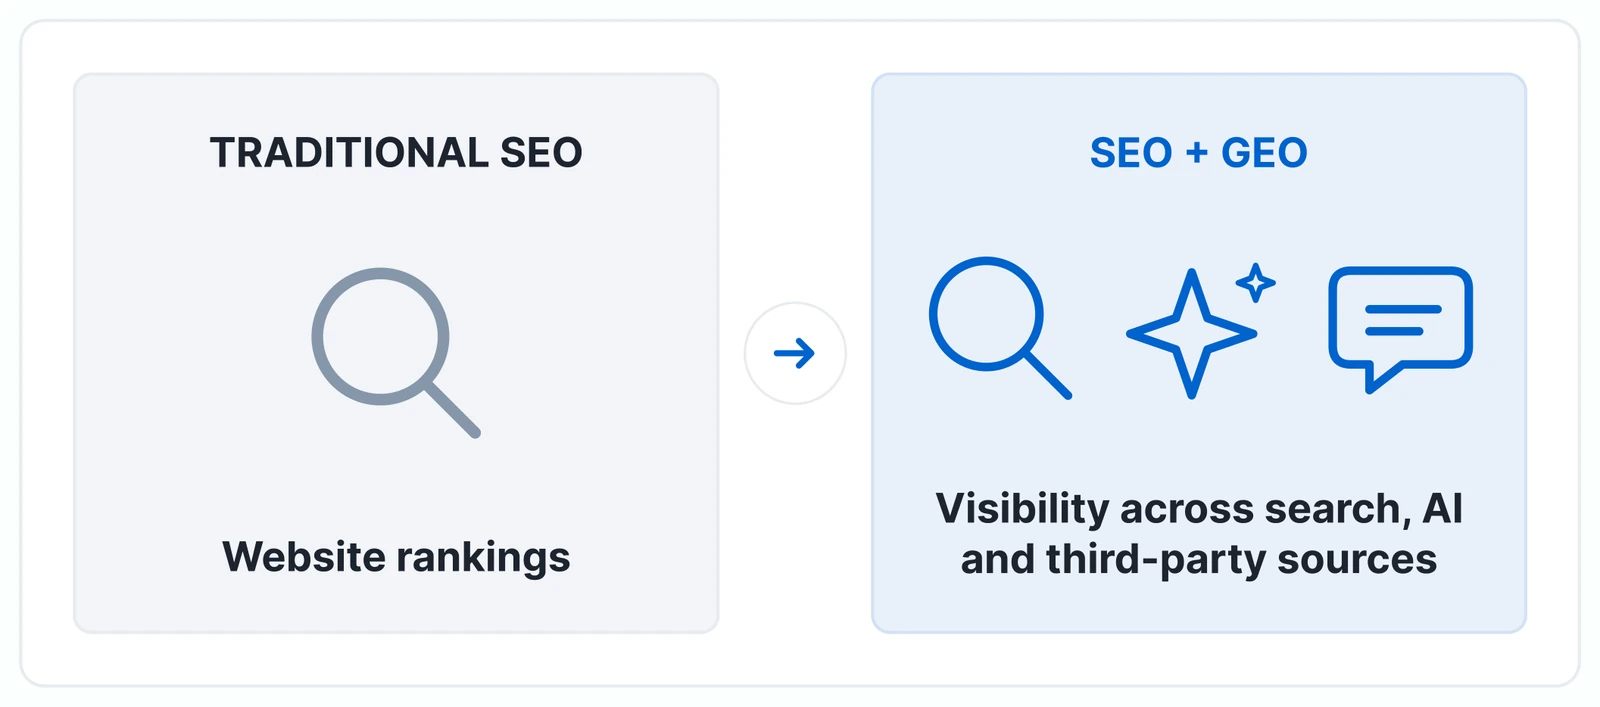
My own priority sits under the fifth. For the keywords that bring you money, track whether an Overview shows and whether it cites you, beside the ranking, with a tracker that checks daily or weekly. A #1 ranking under an Overview gets about 21–24% of estimated clicks in DataForSEO's model, against 33–38% on pages without one, and a citation is the part of that page you can still win. In Seer Interactive's 2025 data, cited brands' informational queries averaged more than twice the CTR of uncited ones. To see how often AI answers name your brand against competitors, a free AI brand visibility check gives a first share-of-voice reading, and the AI Visibility Tracker runs your buyers' prompts in ChatGPT, Gemini, Claude and Grok every day.
If you already track rankings, our Rank Tracker records AI Overview citations and SERP features next to each daily position. For the wider shift from ranking to being cited, our guide to answer engine optimization covers what to change on the page, and the AI SEO statistics roundup tracks the trends beyond Google.
AI Overviews appeared on 61.43% of US Google results pages in August 2026, up from 5.93% in September 2024, in DataForSEO's 20M-keyword monthly panel. Featured snippets fell from 8.96% to 0.44% over the same period. On results pages with an Overview, its citations take an estimated 42–45% of clicks and the #1 organic result 21–24%, against 33–38% on pages without one (DataForSEO, modelled clickstream, 7 September 2026). Informational queries trigger Overviews most often (70.44% in Q3 2026, partial to 14 September), and YouTube is the most-cited domain with 51.9 million citations. On Cloudflare's network, Google made about 3.8 crawl requests per referral in October 2026, about the same as in January 2025.
Between 39% and 61% in mid-2026, depending on what is counted. DataForSEO's keyword panel read 61.43% of US results pages in August 2026; its quarterly panel of keywords with 100+ monthly searches read 53.39% for Q3 2026 (to 14 September). Comscore counted 39.4% of US desktop searches in June 2026. The keyword panels measure the results pages of tracked keywords; Comscore counts the searches people actually ran on desktop, so the samples, devices and dates differ. Pew measured 18% of the searches its panel made in March 2025, before the largest jumps. Quote the figure with its panel and month.
In DataForSEO's clickstream model, the #1 organic result gets 20.7–24.1% of estimated clicks on results pages with an Overview, against 33.4–37.6% without one, and the top 10 together get about half, against 73.6–88.8%. Measured data agrees on direction: Pew found users clicked a traditional result on 8% of visits to pages with an AI summary against 15% without one, in March 2025. Seer Interactive measured organic CTR on its Overview query cohort at 1.3% in December 2025 and 2.4% in February 2026, against 3.8% on queries without an Overview. The size of the loss depends on intent, device and whether you are cited.
Featured snippets largely disappeared as AI Overviews spread, though no dataset here tracks one replacing the other query by query. Featured snippets showed on 8.96% of results pages in September 2024 and on 0.44% in August 2026, a 95.1% fall, while AI Overviews rose from 5.93% to 61.43% in DataForSEO's monthly panel. Overviews passed featured snippets in December 2024 and have stayed ahead since. The two work differently: a featured snippet quoted one page, while an AI Overview usually cites several, and Pew found 88% of AI summaries in its March 2025 sample cited three or more sources.
Health leads, with AI Overviews on 69.68% of US results pages, followed by Finance (68.80%), Family & Community (68.63%), Computers & Consumer Electronics (67.34%) and News, Media & Publications (65.52%), in DataForSEO's June to September 2026 dataset. The lowest rates were in Real Estate (22.27%), Dining & Nightlife (29.37%), Apparel (37.48%) and Retailers & General Merchandise (43.33%). The overall rate across industries was 56.67%. Quote an industry's rate with that window: in DataForSEO's quarterly panel the rate across all intents rose from 37.98% in Q2 2026 to 53.39% in Q3 2026 (partial, to 14 September).
Yes, and increasingly. In DataForSEO's quarterly panel, 51.35% of commercial results pages and 28.64% of transactional ones showed an AI Overview in Q3 2026 (partial, to 14 September), up from 26.30% and 10.82% in Q4 2025. Seer Interactive's sample of 53 brands' queries (published April 2026) found much lower rates for commercial (8%) and transactional (5%) queries, which shows how much the level depends on the keyword set and the period. Comparison queries are the most exposed: Seer found an Overview on 95.4% of informational comparison queries.
YouTube, with 51.9 million citations, then Reddit (25.1 million), Facebook (20.4 million), Wikipedia (19.9 million) and google.com (15.9 million), in DataForSEO's AI Overview dataset snapshot of 14 September 2026 (US English). Instagram, Quora, Fandom, Amazon and TikTok complete the top 10. Pew's March 2025 panel also put Wikipedia, YouTube and Reddit at the top, with 15% of all sources in AI summaries between them. For a business site, the practical reading is that video and community pages are often the citation to beat for a keyword.
Cited brands get more clicks than uncited ones, though fewer than on pages with no Overview. In Seer Interactive's 2025 averages for informational queries, organic CTR was 2.07% where the brand was cited in the Overview, 0.94% where it wasn't and 3.35% with no Overview. Seer notes that one large account pulls the uncited figure down (about 1.61% without it) and that it can't claim causation, since stronger brands are also cited more. Pew found users clicked a link inside an AI summary on just 1% of visits to such pages in March 2025.
More than 2 billion people a month. Alphabet said in its Q2 2025 earnings remarks, on 23 July 2025, that AI Overviews had "over 2 billion monthly users across more than 200 countries and territories and 40 languages". Google also said Overviews were driving "over 10% more queries globally for the types of queries that show them". Comscore counted 77 billion US desktop searches in Q2 2026, up 8% from 71 billion in Q2 2024, so search volume kept growing while Overviews spread.
Yes. On Cloudflare's network, Google made 3.76 crawl requests per referral in October 2026 and 3.79 in January 2025, in our analysis of Cloudflare Radar, and its 2026 monthly ratio has stayed between 3.73 and 4.31. Google also sent 91.25% of the referrals Radar attributes to crawler platforms in October 2026, against 0.16% from chatgpt.com. These are global ratios and shares rather than visit counts. They show that Google's ratio ended where it started after a spike in spring 2025; they can't show how many visits any one site gets.
Search each keyword in a clean browser session for the country you target, or use a tool that fetches the live results page for you, such as a SERP rank checker. SEOmator's free AI Overview keywords checker shows whether a keyword triggers an Overview and lists every source it cites, in 213 countries. Overviews change often (the US rate rose 16.43 points between April and August 2026), so check your most valuable keywords at least monthly, or track them daily with a rank tracker, and record which pages the Overview cites, not only whether it appears.
DataForSEO, Search Insider: 2026 Edition (October 2026) supplies the AI Overview, SERP feature, click share, CTR, trigger rate and citation figures. We credit it by name and use its published tables (A2, A3, A4, B1–B5, C3, D5); every derived figure on this page, such as growth multiples, point changes and the all-intent rates, was computed in code from those tables. Its datasets differ by sample and window:
DataForSEO's SERP and AI answer figures are US English and its CTR data covers US searches; only the backlink records behind the referring-domain figures are global.
Cloudflare Radar supplies our own analysis of Google's crawl-to-refer ratio, Googlebot's share of crawler requests and Google's share of crawler-platform referrals. We called bots/crawlers/summary/crawl_refer_ratio, bots/crawlers/summary/user_agent and bots/crawlers/summary/referer once per calendar month from January 2025 to October 2026, with no filters, on 17 November 2026. Radar reports ratios and shares of requests on Cloudflare's global network, not counts, and it revises history: in November 2026 it lowered every crawl-to-refer ratio by exactly 1.0, so ratios pulled earlier are not comparable.
Other publishers, each read on its own page: Pew Research Center (900 US adults' browsing in March 2025, 68,879 Google searches re-run on 7–17 April 2025 to see their results pages), Seer Interactive (53 brands, January 2025 to February 2026), Comscore's Q2 2026 AI Intelligence Report as reported by Search Engine Land (US desktop, to June 2026) and Alphabet's Q2 2025 earnings remarks.
What these figures can't see: searches outside the US (DataForSEO), sites not on Cloudflare and absolute request counts (Radar), the clicks that actually happen on each results page (the click shares are modelled), and why any month moved.
How to cite: "SEOmator, Google AI Overview Statistics (November 2026), seomator.com/blog/ai-overview-statistics", naming DataForSEO's Search Insider 2026 or Cloudflare Radar with the window for the figure you quote. We re-check the Radar figures monthly.
Who wrote it, what changed and how to tell us about a mistake.

Emre Elbeyoglu
Founder & CEO, SEOmator
16+ years in B2B SaaS SEO and growth
Emre Elbeyoglu is founder and CEO of SEOmator. Alongside running the company, Emre is its Head of Growth and leads all of SEOmator's growth work. Emre is also the founder and director of Next Marketing Technology Ltd, the London company that has owned and operated SEOmator since 2023. Emre has worked in B2B SaaS SEO and growth marketing for more than 16 years and builds every acquisition channel on search: that approach has generated $10M+ in total revenue from organic search across Emre's products, driven 300K+ monthly organic visitors and earned 10K+ referring backlinks.
In 2013 Emre co-founded Flatart, a digital marketing agency that ran SEO and growth programs for brands including Investing.com, Rakuten and EuroDNS. That consulting work turned into products: Popupsmart, an AI-powered conversion rate optimization platform used by 600+ clients, and LiveChatAI, an AI customer support tool covered by WIRED. Emre also publishes growth marketing experiments at GrowthMarketing.ai.
Published.Written by Emre Elbeyoglu
Spot a mistake or a number that has gone stale? Tell us. We correct it and log the change in the History above. Report an error →
· 21 min read
30+ sourced AI SEO stats for 2026: AI Overviews reach 2B users, organic CTR drops 61% where they appear, and AI traffic converts up to 23x better. See the data.

· 14 min read
ClaudeBot is Anthropic's AI training crawler, one of three. In our check of 10,000 top sites, 64% of those that block it still let Claude-SearchBot in.
· 35 min read
I completed six AI SEO courses in the past year. Here's the order I'd take them in, who each one suits, and what they cost, from free to $319 a month.


