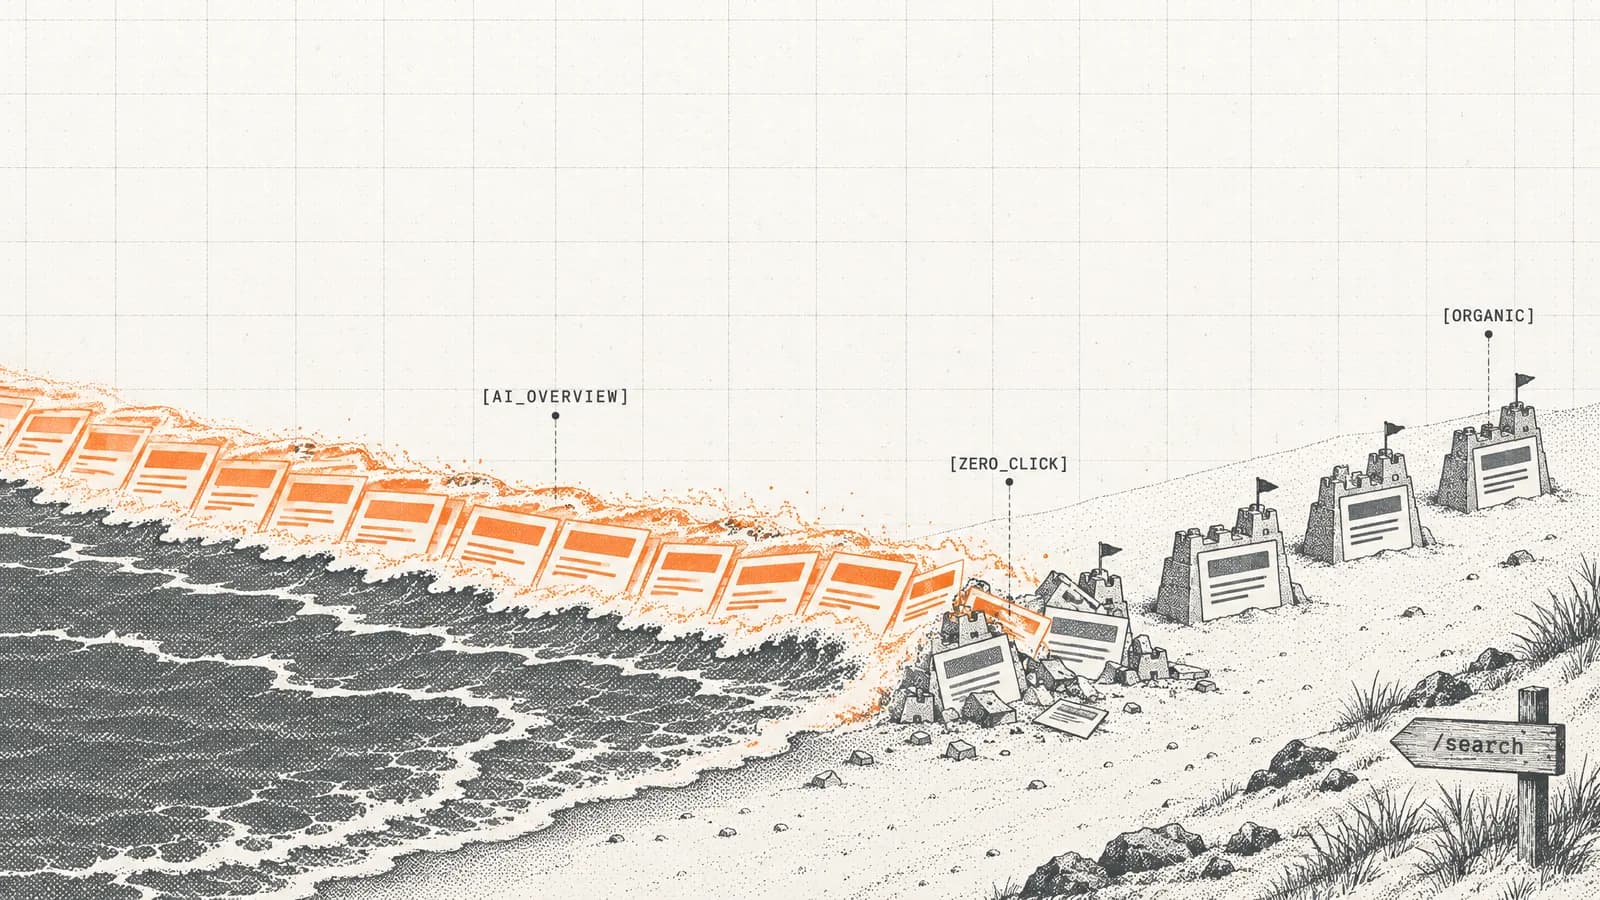
Cloudflare Radar data shows Perplexity now crawls 885 pages for every visitor it sends back, and Anthropic 823. Google takes 5. Since our July edition Anthropic has halved its ratio while Perplexity's has more than doubled — the extraction league table has inverted. Across the 500+ sites SEOmator monitors, AI bots made up ~34% of all bot traffic in July 2026. Meanwhile 2 billion people use Google AI Overviews, organic CTR falls 61% where they appear, and AI-referred traffic converts at 23x organic.
This data-driven guide presents 30+ verified AI SEO statistics for 2026 with original sources, organized by category to help you adapt your strategy. Every Cloudflare Radar figure below was re-pulled on 2 September 2026, and we have flagged each one that moved since July — including two that reversed outright.
Key Takeaways: AI SEO Statistics at a Glance
- 885 pages crawled per referral sent back by Perplexity and 823 : 1 by Anthropic, versus 5.2 : 1 for Google (Cloudflare Radar, 28-day window ending 2 September 2026)
- Anthropic's ratio halved (1,601 → 823) while OpenAI's doubled (226 → 455) over the two most recent 28-day windows — the ratios are no longer all moving the same way (Cloudflare Radar)
- AI bots are ~34% of all bot traffic across the sites SEOmator monitors (July 2026), roughly double January's share — though we broadened our AI-bot classification in June, so part of that step is reclassification (SEOmator — original data)
- GPTBot is the most-disallowed AI crawler — 696 of 4,317 parsed robots.txt files, 527 of them a full block (Cloudflare Radar, 31 August 2026); SEOmator's own 4,257-file crawl found the same ordering
- Meta-ExternalAgent is now the biggest non-search AI crawler at 14.2% of AI bot traffic, having passed ClaudeBot, which fell 19.3% → 11.2% since July (Cloudflare Radar)
- Search-purpose crawling jumped 10.8% → 17.4% of AI crawls while training fell 46.8% → 39.5% (Cloudflare Radar)
- 2 billion monthly users engage with Google AI Overviews
- 61% drop in organic CTR when AI Overviews appear (1.76% → 0.61%)
- 93% zero-click rate in Google's AI Mode
- 23x higher conversions from AI-referred traffic vs. organic search
- 64.5% market share for ChatGPT among AI chatbots (down from 86.7% in early 2025)
- $7.3 billion projected GEO market size by 2031
Which AI Crawlers Do the Web's Biggest Sites Actually Block?
Almost every statistic in this article measures demand — how many people use AI search, and what they do afterwards. Nobody publishes the supply side: whether the pages those engines want to read are even open to them. So we measured it, at two different resolutions.
The wide cut. SEOmator's crawler parses robots.txt on every audit it runs. Across 4,257 top-domain robots.txt files parsed on 20 July 2026, GPTBot was the most-named AI agent (773 files), ahead of ClaudeBot (629), Google-Extended (578) and CCBot (568). AI opt-out is now the most common reason a site writes crawler rules at all — the AI agents outrank Googlebot (425) in the file that was invented for Googlebot.
That matters because of what the bots are now doing. Across the 500+ sites monitored by SEOmator Agent Analytics, AI bots — crawlers, assistants and AI-search agents combined — were ~34% of all bot traffic in July 2026, against ~18% in January. Treat that step as directional rather than exact: we broadened our AI-bot classification in June 2026, so some of the increase is bots being reclassified rather than newly arriving. What is not a classification artifact is the rejection rate — more than one in three crawler requests (36.4% in July 2026) is turned away. The supply side is not a footnote; it is roughly a third of the robot traffic hitting your server, and a third of that is bouncing off.
The deep cut. On 13 July 2026 we fetched and parsed the robots.txt of 48 high-traffic sites across news, ecommerce, SaaS, SEO, reference, travel, finance, and health, recording per site which AI user-agents carry an explicit Disallow rule. That smaller, hand-checked sample is what the per-crawler table below is built from.
62% of those 48 sites name at least one AI crawler in robots.txt. 46% actually block one. 54% leave every AI bot free to crawl.
Here is the per-crawler breakdown:
| AI crawler | Operator | What it feeds | Sites blocking it | % of 48 |
|---|
| ClaudeBot | Anthropic | Claude training | 11 | 23% |
| GPTBot | OpenAI | ChatGPT training | 10 | 21% |
| PerplexityBot | Perplexity | Perplexity index | 10 | 21% |
| Google-Extended | Google | Gemini / AI training | 10 | 21% |
| CCBot | Common Crawl | Open dataset behind many LLMs | 10 | 21% |
| meta-externalagent | Meta | Llama training | 9 | 19% |
| Bytespider | ByteDance | Doubao / TikTok AI | 8 | 17% |
| OAI-SearchBot | OpenAI | ChatGPT Search index | 8 | 17% |
| ChatGPT-User | OpenAI | Live user-triggered fetches | 8 | 17% |
| Applebot-Extended | Apple | Apple Intelligence training | 7 | 15% |
| Claude-Web | Anthropic | Claude live fetches | 7 | 15% |
| Amazonbot | Amazon | Alexa / Rufus | 7 | 15% |
Source: SEOmator robots.txt scan of 48 high-traffic sites, 13 July 2026. The gap between ClaudeBot (11 sites) and GPTBot (10 sites) is a single site — see the correction below before reading an ordering into it.
⚠️Correction, 14 July 2026: An earlier version of this article led with the claim that ClaudeBot is blocked more often than GPTBot. We are retracting it. At n=48, our 23% vs 21% is 11 sites versus 10 — a one-site difference, which is sampling noise, not a finding. Cloudflare Radar's web-scale robots.txt dataset orders them the other way: GPTBot is the most-disallowed AI crawler, and we defer to the larger dataset. We have left our own numbers on the page so you can see exactly what changed.
Update, 2 September 2026: the correction holds, and it is now settled by two independent datasets rather than one. Our own 4,257-file robots.txt crawl (20 July 2026) puts GPTBot first at 773 files to ClaudeBot's 629, and Cloudflare's 31 August scan puts GPTBot first again at 696 disallow rules to ClaudeBot's 618. Same ordering, three samples, two organizations.
📊By the Numbers: Across 4,257 robots.txt files SEOmator parsed in July 2026, GPTBot is the most-named AI agent (773 files) — ahead of ClaudeBot (629) and of Googlebot (425). In the hand-checked 48-site cut, 46% block at least one AI crawler and 54% leave every AI bot free to crawl; 62% name an AI crawler but only 46% block one, because many name them in order to allow them.
Three findings stand out.
GPTBot and ClaudeBot are effectively tied in the small sample — but GPTBot leads at scale. In our 48-site cut GPTBot is disallowed on 10 sites and ClaudeBot on 11. That is one site, and a sample of 48 cannot resolve a one-site gap into a ranking. Read that table as a tie. The ordering question is answered by the bigger scans: our own 4,257-file crawl and Cloudflare's both put GPTBot clearly in front, which is the number to quote.
Blocking is bimodal, not gradual. Sites don't partially restrict. The 11 sites that block ClaudeBot are overwhelmingly the same sites that block GPTBot, CCBot, and Bytespider. News and health publishers (nytimes.com, bbc.com, washingtonpost.com, healthline.com, webmd.com) block broadly; almost every SaaS and ecommerce site in the sample blocks nothing at all.
Google-Extended is blocked at the same rate as GPTBot (21%), not more. Common Crawl's CCBot — the dataset behind many LLMs — is blocked by 21% of the sites we scanned. Blocking Google-Extended does not remove a site from Google Search or from AI Overviews; it only opts the site out of Gemini training. Some publishers appear to have blocked it without realizing that distinction cuts both ways.
Methodology, and its limit. A site counts as "blocking" a crawler only when that crawler has its own user-agent group with a non-empty Disallow rule. Two of the 48 sites returned no parseable robots.txt and are counted as blocking nothing. Most importantly: robots.txt is a declared preference, not an enforcement mechanism. It shows publisher intent. It does not prove a bot complied, and it doesn't tell you which bots actually reached your server. For that you need server-side logs — which is what SEOmator's agent analytics reads.
What Does Cloudflare's Web-Scale Data Say About AI Crawlers?
Our scan measures publisher intent on 48 sites. Cloudflare Radar measures what the crawlers actually do, across a slice of the internet orders of magnitude larger than anything we can fetch ourselves. It is a separate dataset from ours, with a different sample and a different method — and it is the reason for the correction above.
It also contains the single most important number in AI SEO right now, and almost nobody is quoting it.
How many pages does an AI crawler take for every visitor it sends back?
The crawl-to-refer ratio counts how many pages an operator crawls for each one referral it sends back to the sites it crawled. It is a ratio, not a percentage — read it as "pages taken per visitor returned."
| Operator | Pages per referral (28d to 2 Sep) | Previous 28 days | Move |
|---|
| Mistral | no referrals recorded | 38,921 : 1 | — |
| Perplexity | 885.0 : 1 | 370.6 : 1 | ▲ +139% |
| Anthropic | 823.4 : 1 | 1,601.4 : 1 | ▼ −49% |
| OpenAI | 454.7 : 1 | 226.1 : 1 | ▲ +101% |
| Microsoft | 35.4 : 1 | 37.2 : 1 | ▼ −5% |
| Yandex | 30.2 : 1 | 28.3 : 1 | ▲ +6% |
| Baidu | 14.7 : 1 | 12.4 : 1 | ▲ +19% |
| ByteDance | 11.3 : 1 | 9.0 : 1 | ▲ +26% |
| Google | 5.2 : 1 | 4.8 : 1 | ▲ +8% |
| DuckDuckGo | 1.7 : 1 | 2.3 : 1 | ▼ −24% |
Source: Cloudflare Radar (radar.cloudflare.com), bots/crawlers/summary/crawl_refer_ratio, 28-day window ending 2 September 2026, compared with the preceding 28 days. Mistral crawled but returned no measurable referrals in the current window, so Radar reports its ratio as infinite rather than as a number.
📊By the Numbers: Google crawls about 5 pages for every visitor it sends you. Perplexity crawls 885, Anthropic 823, OpenAI 455. Mistral returned no referrals at all. The traffic-for-content bargain that funded the open web still holds at Google's ratio. It does not survive at any of the others. Source: Cloudflare Radar, 28-day window ending 2 September 2026.
These ratios move fast, and — correcting what we wrote in July — they are no longer all moving the same way. In our July edition we said the ratios "have been moving in one direction." They have not. Over the two most recent 28-day windows Anthropic halved (1,601 → 823) while OpenAI doubled (226 → 455) and Perplexity rose 139% (371 → 885). Perplexity, which we held up in July as one of the more restrained operators at 226 : 1, is now the most extractive named operator on the board.
Our own data caught the same reversal from the other side of the wire. Across the sites SEOmator monitors, Anthropic's crawl-to-referral ratio collapsed from roughly 56,969 : 1 in January 2026 to about 2,363 : 1 by July, and Perplexity's moved the wrong way over the same months, from ~116 : 1 to ~263 : 1. Two independent panels — one global, one ours, on different samples — agree on both of those directions, which is worth more than either number alone.
OpenAI is the interesting disagreement, and it is a disagreement about when, not about what. Our panel shows OpenAI improving steadily through the first half of the year, from ~1,264 : 1 in January to ~179 : 1 in July. Radar's preceding 28-day window put it at 226 : 1 — close to where we left it — and then the most recent window has it back up at 455 : 1. Read together rather than against each other, the two series say OpenAI spent H1 getting materially better and then gave up about half of that gain in August. Our AI crawler crawl-to-refer report breaks the full series out by operator and by industry — finance sites earn the best return of any vertical, shopping sites the worst.
That table is the economics of AI search in one line. Search engines crawled you because they intended to send you traffic; the crawl was the cost of the referral. AI assistants crawl you because they intend to answer instead of you. Google's 5.2 : 1 and DuckDuckGo's 1.7 : 1 are what a working exchange looks like. Perplexity's 885 : 1 is not an exchange at all.
The practical lesson is not "block Anthropic" — by this metric Anthropic is the operator improving fastest. It is that the exchange rate on your content is repriced every few weeks, by each operator independently, and nobody sends you a notice. A blocking policy set in July was already out of date by September.
This is why "just optimize for AI search" is an incomplete instruction. For most of these operators there is no traffic to optimize for. What you are optimizing for is a citation — a brand impression inside someone else's answer — and you should budget and measure it as brand media, not as an acquisition channel.
Which AI bots actually crawl the most?
Radar's 28-day share of AI bot traffic ranks the crawlers by the volume they actually pull:
| AI bot | Operator | Share (28d to 2 Sep) | Mid-July |
|---|
| Googlebot | Google | 22.4% | 24.8% |
| (other / unclassified) | — | 14.6% | — |
| Meta-ExternalAgent | Meta | 14.2% | 10.6% |
| ClaudeBot | Anthropic | 11.2% | 19.3% |
| Amazonbot | Amazon | 8.6% | 5.7% |
| GPTBot | OpenAI | 8.0% | 9.6% |
| Bingbot | Microsoft | 7.0% | 8.5% |
| Applebot | Apple | 6.6% | 5.9% |
| Bytespider | ByteDance | 3.7% | 7.1% |
| Claude-SearchBot | Anthropic | 3.7% | — |
Source: Cloudflare Radar, ai/bots/summary/user_agent, 28-day window ending 2 September 2026, with our July figures for comparison.
This is the table that changed most since July, and the July version of this article got overtaken by it. ClaudeBot has fallen from 19.3% to 11.2%, and Meta-ExternalAgent has passed it at 14.2% to become the largest single non-search AI crawler. Bytespider roughly halved. Amazonbot rose by half. Because this ranking reshuffles faster than an annual statistics round-up can track, we re-cut it every month in the AI crawler report.
Read the operator, not just the user-agent, before drawing a conclusion. Anthropic now splits its crawling across two agents — ClaudeBot at 11.2% plus Claude-SearchBot at 3.7% — so Anthropic's combined footprint, about 14.9%, still edges Meta's single agent. The headline "ClaudeBot is the most aggressive crawler on the web" is no longer true as written, but "Anthropic is still the largest non-search AI operator" is. That distinction is exactly the kind that gets lost when a statistic is copied from post to post for six months.
The stable insight underneath the churn is why publishers block what they block. Blocking decisions are not made from press coverage; they are made from bandwidth bills and server logs. A crawler that arrives at volume earns a rule, and it earns it within weeks of arriving — which is why Meta-ExternalAgent, barely discussed in AI-SEO writing, already carries an explicit disallow on 494 of the robots.txt files Cloudflare parsed.
What are the crawlers actually taking your content for?
Radar classifies each AI crawl by declared purpose:
| Crawl purpose | Share (28d to 2 Sep) | Mid-July | Move |
|---|
| Training | 39.5% | 46.8% | ▼ −7.3pp |
| Mixed purpose | 36.1% | 39.2% | ▼ −3.1pp |
| Search | 17.4% | 10.8% | ▲ +6.6pp |
| User action | 5.2% | 2.5% | ▲ +2.7pp |
| Undeclared | 1.8% | — | — |
Source: Cloudflare Radar, ai/bots/summary/crawl_purpose, 28-day window ending 2 September 2026, with our July figures for comparison.
This is the most encouraging trend in the whole article, and it is the one nobody is reporting. Search-purpose crawling — the one purpose that can actually cite you and send a reader — has gone from about 1 crawl in 9 to closer to 1 in 6, while pure training crawling dropped more than seven points. User-triggered fetches, where a real person asked an assistant to go read your page right now, doubled to 5.2%.
Our own panel independently shows the same rise from a lower base: across the sites SEOmator monitors, search/answer-purpose crawling climbed from 8.3% of AI-bot hits in January 2026 to 12.4% in July. Different denominator, same direction. The mix of AI crawling is shifting away from corpus-building and toward answering live questions — which means a growing share of the bots at your door are ones with a reason to name you.
That raises the value of making the search-purpose crawlers easy to serve. A curated llms.txt file points them at the pages you actually want quoted, rather than leaving them to reconstruct your site from whatever they happen to hit first.
⚠️Common Mistake: Reading rising AI crawler traffic in your logs as rising AI visibility. Even after the shift toward search, Cloudflare Radar puts 39.5% of AI crawling at training and only 17.4% at search. Most of the bots hitting your server are still not shopping for something to cite. Crawl volume is not a visibility metric — but the share that is a visibility signal has grown by half since July, so re-measure rather than assuming either way.
What does robots.txt look like at web scale?
Radar also scans robots.txt across a far larger set of domains than we do. This is where its data overrules ours on the ordering:
| AI crawler | Files disallowing it | Of which, a full block | Share of files |
|---|
| GPTBot | 696 | 527 | 16.1% |
| ClaudeBot | 618 | 473 | 14.3% |
| CCBot | 604 | 506 | 14.0% |
| Google-Extended | 572 | 430 | 13.2% |
| Bytespider | 551 | 488 | 12.8% |
| meta-externalagent | 494 | 418 | 11.4% |
| Amazonbot | 471 | 389 | 10.9% |
| Applebot-Extended | 450 | 372 | 10.4% |
| PerplexityBot | 326 | 178 | 7.6% |
| Googlebot | 307 | 25 | 7.1% |
Source: Cloudflare Radar robots.txt scan, 31 August 2026, across 4,317 robots.txt files parsed that day. Radar now publishes that denominator, so unlike our July edition these can honestly be read as shares — of the files parsed, not of the web.
Three things to take from this table.
Radar now shows its denominator, so we can stop hedging. In July we printed these as raw counts and warned you not to read them as percentages, because Cloudflare did not publish what they were counts of. The scan now reports 4,317 files parsed, so the share column above is real. One caveat survives: that is a daily sample of top-domain robots.txt files, not a census of the web.
GPTBot leads the disallow list, and the gap widened. 696 files disallow GPTBot against ClaudeBot's 618. Both counts grew by roughly 15% since July — the blocking is still spreading, not plateauing — and the ordering is the same one our own 4,257-file crawl found independently.
Almost nobody blocks Google, and this is the starkest number in the article. Googlebot appears in 307 files, but only 25 block it fully; the other 282 are partial rules carving out a checkout flow or a search-results directory. Compare that with GPTBot's 527 full blocks — 21 times as many. Publishers will slam the door on an AI crawler and hold it wide open for the search engine, which tells you exactly how they price the two. The crawl-to-refer table above tells you they are right to.
One nuance worth keeping: GPTBot is simultaneously the most-disallowed and the most-allowed AI crawler. 696 files disallow it, and 299 write an explicit Allow rule for it — more than for any other AI agent, with PerplexityBot second at 295. GPTBot is not simply the most-blocked bot on the web. It is the most deliberated-about bot on the web: the one publishers actually make a decision about, in both directions. Every other crawler mostly gets whatever the block-list template said.
Which raises the only question in this section you can act on today: which of these rules are in your robots.txt, and did anyone at your company choose them? Run it through a robots.txt tester and find out before you read another statistic.
How AI-Ready Is the Web, Actually?
Barely at all — and the gap is lopsided in a way that is worth exploiting. In a scan of 107,002 domains on 31 August 2026, Cloudflare Radar found that 80.4% already publish AI rules in robots.txt, but only 9.3% will serve an agent a clean, machine-readable version of a page, and only 8.6% publish content signals. The web has made up its mind about saying no to AI. It has done almost nothing about being understood by it.
| Signal | Share of the 107,002 domains scanned | What it means |
|---|
Has a robots.txt | 83.6% | Table stakes; 1 in 6 domains still has none |
Has AI rules in robots.txt | 80.4% | Near-universal — 96% of the domains that have a robots.txt at all |
| Has a sitemap | 67.8% | 32.2% of top domains have no sitemap — and this fell since July |
| Link headers | 9.5% | Machine-readable relations; still niche |
| Markdown negotiation (serves agents a clean version) | 9.3% | Effectively empty, up from 8.4% in July |
| OAuth discovery | 8.7% | Agent authentication surface |
| Content signals | 8.6% | Effectively empty, up from 6.8% |
| UCP (agent commerce) | 7.0% | Early |
| MCP server card | 0.3% | Not yet a thing |
| Web Bot Auth | 0.1% | Not yet a thing |
Source: Cloudflare Radar agent_readiness scan (radar.cloudflare.com), 107,002 domains, 31 August 2026. Radar returns raw domain counts here, not percentages — the shares above are counts divided by the domains successfully scanned. This dataset is Cloudflare's, not ours; the analysis of what it means for SEO is ours.
We ran the same class of check independently. SEOmator's audit engine scanned 109,440 top domains on 20 July 2026 and found 81.2% publishing AI-crawler rules against just 6.6% serving markdown to agents — two different scanners, two different domain lists, the same lopsided verdict. You can run the check on a single site with our GEO audit tool.
We went narrower on one of these signals in September. Requesting /llms.txt from all 100,000 domains in Cloudflare Radar's top-100k list, we found 8,598 publish one — 8.6%, sitting right alongside the markdown-negotiation rate above. The full llms.txt census also explains the ecommerce anomaly in the next table: Shopify wrote 18.2% of every file we found, so a large share of what reads as "adoption" is one platform's default.
The asymmetry is the whole story. Deciding whether to block an AI crawler is a crowded room — four out of five domains have already taken a position. Deciding whether an AI crawler can actually read you is an empty one. If you want an edge in AI search, the block decision is not where it is hiding. Everyone has made that call. Almost nobody has made the second one. And the six weeks between our two scans barely moved it: markdown negotiation crept from 8.4% to 9.3%. At that rate the room stays empty for years.
Ecommerce is the exception, and the reason matters
One vertical breaks the pattern hard:
| Vertical | Markdown negotiation | Sitemap |
|---|
| Ecommerce | 28.8% | 79.6% |
| Shopping & Auctions | 26.5% | 78.6% |
| Sports | 10.6% | 68.6% |
| Business & Economy | 9.5% | 76.5% |
| Health | 9.4% | 75.0% |
| Technology | 6.8% | 68.9% |
| Information Technology | 5.1% | 66.9% |
| Entertainment | 3.4% | 67.3% |
| Education | 3.1% | 54.6% |
| News & Media | 1.9% | 76.9% |
Source: Cloudflare Radar agent_readiness, by domain category, 31 August 2026. Ecommerce n=21,041; Technology n=40,823; News & Media n=5,471.
Ecommerce serves agents machine-readable pages at 28.8% — roughly 6× the rate of Information Technology (5.1%) and 15× News & Media (1.9%). The Shopping & Auctions category corroborates it independently at 26.5%, so this is not a sampling artifact. The gap narrowed slightly since July, but only because the rest of the web crept up, not because ecommerce slipped.
Here is the part worth sitting with: the tech industry writes about AI readiness and the shopping cart industry ships it. And ecommerce almost certainly did not ship it on purpose — the rate tracks hosted platforms (Shopify, BigCommerce and friends) turning the feature on by default for every store on them. Which is precisely why it is a leading indicator rather than a curiosity. This is what the default looks like once a platform decides for you. Every other vertical is still opting in by hand, and mostly not bothering.
The payoff for bothering is not small, and it grew. Radar measures serving markdown instead of HTML to an agent as an 8.9× payload reduction (ai/markdown_for_agents, 28 days to 2 September 2026, up from 7.1× in July) — the same content, a ninth of the bytes, and none of the navigation, cookie banners and script tags a model has to discard before it can find your answer.
The finding SEOs should be angriest about
32.2% of the top 107,002 domains have no sitemap at all. In education it is 45.4%. Worse, that number moved the wrong way: sitemap coverage fell from 69.2% in July to 67.8% in August. This is not an AI problem or a 2026 problem — it is a 2005 problem, still unsolved on nearly a third of the most-visited sites on the internet, and quietly getting worse at exactly the moment a second class of crawler started reading the web.
The order of operations follows from the data, and it is not the order most AI-SEO advice gives you:
- Have a sitemap. 32.2% don't. Find yours — if the URL 404s, that is your answer and nothing below matters yet.
- Know what your robots.txt says about AI, because 80.4% of the web already made this call and yours may have been made for you by a template. Test it.
- Then consider the readability layer — markdown negotiation, content signals — where fewer than 1 in 12 sites has bothered and the room is still empty.
Most GEO advice starts at step 3. The data says a third of the web has not finished step 1.
How Is AI Changing Search Behavior in 2026?
AI is reshaping how users interact with search engines. The introduction of AI Overviews, ChatGPT Search, and Perplexity has moved users from clicking links to consuming AI-generated summaries.
AI now processes and interprets search queries with unprecedented sophistication. Rather than matching keywords, modern AI understands user intent, context, and the relationships between concepts.
One system retrieves documents; the other composes an answer — and the two reward different work. Our SearchGPT and traditional search comparison walks through what changes for keyword, backlink and structured-data strategy once the result is generated rather than ranked.
The traffic follows. AI search traffic grew 527% year over year, according to Semrush's 2026 AI SEO report — faster than any other referral channel, from a small base.
What Are the Latest Google AI Overview Statistics?
Google's AI Overviews have become the most significant change to search results since featured snippets. Here's what the data shows:
AI Overview Reach and Prevalence
- 2 billion monthly users engage with AI Overviews across 200+ countries and 40 languages. (Source: Position Digital, 2026)
- 30% of U.S. desktop keywords now trigger AI Overviews – a new high as of September 2025. (Source: Semrush, 2026)
- 57.9% of question-based queries display an AI Overview. (Source: Position Digital, 2026)
- AI Mode has 100 million monthly active users in the US and India. (Source: Sundar Pichai, Alphabet Q2 2025 earnings call)
Not every keyword is exposed equally. Question-shaped queries draw an AI Overview roughly twice as often as the desktop average, which is why the format of your target keyword now matters as much as its volume. You can check which of your own terms trigger one with the Google AI Overview keywords checker.
Click-Through Rate Impact
- Organic CTR has dropped 61% for queries with AI Overviews – from 1.76% to just 0.61%. (Source: Seer Interactive, 2025)
- Individual websites experience an average 34.5% CTR reduction when AI Overviews appear for their keywords. (Source: Ahrefs' 2025 study of AI Overviews and clicks)
- Paid search CTR has declined by 68% – even more severe than organic. (Source: Seer Interactive, 2025)
- However, being cited in AI Overviews increases organic CTR by 35% compared to not being cited. (Source: Seer Interactive, 2025)
- The floor may already be in: AI Overview CTR bottomed out at 1.3% in December 2025 and recovered to 2.4% by February 2026. (Source: Search Engine Land, 2026)
🔑Key Takeaway: The CTR collapse is not uniform. Pages cited inside an AI Overview see CTR rise 35% versus uncited pages on the same query. The penalty is for being absent from the answer, not for the answer existing.
How Do Zero-Click Searches Affect SEO Strategy?
Zero-click searches – where users get their answer without clicking any result – have become the dominant search behavior in 2026. But the headline number depends entirely on what you're measuring.
| Search context | Ends without a click | Source |
|---|
| Google searches with an AI Overview | 43% | ALM Corp, 2026 |
| Google AI Mode | 93% | ALM Corp, 2026 |
| All US Google searches (estimates vary) | 34%–68% | Multiple clickstream panels |
Source: ALM Corp, 2026; range for all-searches figure compiled from published 2024–2026 clickstream studies.
That third row is the honest one. Published estimates for the share of all Google searches ending without a click run from 34% to 68%, depending on whether clicks to Google's own properties count, which clickstream panel is used, and whether the sample is desktop or mixed. The direction isn't in dispute. The decimal is. Any post quoting a single all-searches zero-click figure to two decimal places is overstating what the data supports.
26% of users leave Google entirely after reading an AI Overview, up from 16% without one. (Source: Pew Research, 2025)
Looking forward: Gartner projects traditional search engine volume will drop 25% by the end of 2026, and by 2028 roughly 50% of all searches are expected to be generative. (Source: Gartner, 2024 prediction, reported via Incremys, 2026)
At a 93% zero-click rate, AI Mode is a visibility channel rather than a traffic channel, and it cites a different source mix than AI Overviews do. That makes it worth checking on its own terms with the Google AI Mode checker rather than inferring your presence from AI Overview data.
📌Pro Tip: Track AI Mode separately from AI Overviews, and report it separately too. A 93% zero-click rate means the metric that matters is citation share, not sessions — measuring it as traffic will make a working channel look like a failing one.
What Is the Current AI Chatbot Market Share?
The AI search market has become increasingly competitive. Here's how the major players stack up in February 2026:
| AI Platform | Market Share (Feb 2026) | Change from Jan 2025 |
|---|
| ChatGPT | 64.5% | ↓ 22.2 percentage points |
| Google Gemini | 21.5% | ↑ 15.8 percentage points |
| Grok (xAI) | 2.3% | ↑ New entrant |
| Perplexity | 2.0% | ↓ 0.4 percentage points |
| Others | 9.7% | Various |
Source: First Page Sage, February 2026
ChatGPT remains dominant but has lost significant ground. Google Gemini has been the biggest winner, nearly quadrupling its market share in 12 months.
⚠️Common Mistake: Quoting ChatGPT's "market share" without naming the denominator. 64.5% is its share of AI chatbot usage. Its share of all digital queries — including Google — is closer to 18%. Both numbers are published, they measure different things, and mixing them produces nonsense forecasts.
How Is ChatGPT Impacting Website Traffic?
- 800 million to 1 billion weekly active users in early 2026 – roughly 10% of the world now uses ChatGPT. (Source: Index.dev, 2026)
- AI platforms generated 1.13 billion referral visits in June 2025 – a 357% increase year-over-year. (Source: Search Engine Land, 2025)
- ChatGPT accounts for the majority of all AI referral traffic across tracked datasets. (Source: Search Engine Land, 2025)
- Google didn't collapse in response: average Google Search usage among people who also use ChatGPT sits at 12.6 sessions per week. (Source: Position Digital's 2026 roundup)
Published user-count estimates disagree, and they disagree in a specific way: they mix weekly and monthly actives. Figures for 2026 range from 700 million to 1 billion. Read the metric, not just the headline.
What Are the Key Perplexity AI Statistics?
Perplexity has positioned itself as an AI-first search engine rather than a general chatbot:
- 45 million active users in the second half of 2025 (up 20 million year-over-year). (Source: Business of Apps, 2026)
- $148 million ARR (Annual Recurring Revenue). (Source: SEOProfy, 2026)
- Estimated 1.2-1.5 billion search queries per month by mid-2026. (Source: Business of Apps, 2026)
Perplexity's 2.0% chatbot market share understates its SEO relevance: it cites sources on nearly every answer, and more of the web is open to it than to the big training crawlers — Cloudflare Radar records PerplexityBot disallowed in 326 robots.txt files against GPTBot's 696, under half the rate.
But Perplexity is where this article changed its mind. In July it looked like one of the better-behaved operators at 226 pages crawled per referral returned. As of 2 September it sits at 885 : 1 — the highest of any operator that returns referrals at all, having risen 139% in a single 28-day step while Anthropic's fell by half. Our own panel saw the same direction from January to July, with Perplexity's ratio rising from ~116 : 1 to ~263 : 1 while every other major operator's fell. Treat presence in Perplexity as citation share rather than a traffic line — and if you set your crawler policy on Perplexity's old reputation, re-read it.
How Do AI Citations Work?
Understanding how AI systems select sources is where optimization now starts:
- 76.1% of URLs cited in AI Overviews also rank in Google's top 10. (Source: Ahrefs' 2025 analysis of search rankings and AI citations)
- Branded web mentions have the strongest correlation (0.664) with AI Overview appearances – much higher than backlinks (0.218). (Source: Position Digital, 2026)
- Only 1% of users click a source link inside an AI Overview. (Source: Pew Research, 2025)
The first bullet is contested, and it's worth saying so. Ahrefs puts 76.1% of AI Overview citations inside Google's top 10; other analyses have found a substantially larger share coming from below position 10. The studies used different query sets on different dates and can't be reconciled. What they agree on: a top-10 ranking helps your odds of citation but does not gate it. Pages that rank nowhere still get cited.
🔑Key Takeaway: Branded web mentions correlate with AI Overview citation roughly 3x more strongly than backlinks (0.664 vs 0.218). For AI visibility, being talked about beats being linked to. See our guide to
branded web search.
What Are AI Traffic Conversion Rates?
Despite lower volume, AI-referred traffic is dramatically more valuable:
| Traffic Source | Conversion Rate | Comparison |
|---|
| AI Search Traffic | 14.2% | Baseline |
| Google Organic | 2.8% | 5x lower |
| AI Referral (Signups) | 1.66% | 11x higher than organic (0.15%) |
Sources: Exposure Ninja, 2026; Ahrefs' 2025 report on its own AI-search traffic conversions
- AI-referred visitors convert 23x higher than organic search visitors. (Source: Ahrefs internal data, 2025)
- B2B SaaS companies report 6x to 27x higher conversion rates from AI traffic vs. traditional search. (Source: Exposure Ninja, 2026)
- AI referral visits have 27% lower bounce rates and longer session durations. (Source: Exposure Ninja, 2026)
📊By the Numbers: AI search traffic converts at 14.2% versus 2.8% for Google organic — a 5x gap. The visitor arrives having already been pre-qualified by the assistant, which did the comparison shopping before sending them.
What Is Generative Engine Optimization (GEO)?
GEO is the practice of optimizing content for AI-powered search engines. The market is experiencing explosive growth:
- GEO market size: $886 million (2024) projected to reach $7.3 billion by 2031 – a 34% CAGR. (Source: Incremys, 2026)
- GEO delivers 4.4x higher conversions than traditional SEO. (Source: Semrush, 2026)
- Companies seeing positive GEO ROI report 300-500% returns within 6-12 months. (Source: Superlines, 2026)
🚩Red Flag: Investing in GEO while your robots.txt blocks the crawlers. 46% of the 48 sites we scanned block at least one AI bot, and across the sites we monitor 36.4% of all crawler requests were rejected outright in July 2026 — in most cases against a block list inherited from a 2023-era template nobody has reviewed since. Read your own robots.txt before you spend a dollar on AI visibility.
That's not a hypothetical. Half the sites in our July 2026 sample that block ClaudeBot also publish content marketing aimed at exactly the audiences Claude answers for. Start with a GEO audit that checks crawler access before it checks anything else.
What Factors Improve AI Search Visibility?
Research reveals surprising insights about what drives AI citations:
High-Impact Factors
- YouTube mentions and branded web mentions have the strongest correlation with AI visibility
- Content depth (word count, sentence count) matters significantly
- Readability scores correlate with higher citation rates
- Page speed – faster loading content is more likely to be cited
- Q&A format is the optimal structure for AI extraction — the discipline behind answer engine optimization
Low-Impact Factors
- Traditional backlink counts have minimal impact on AI citations
- Raw traffic volume doesn't predict AI visibility
- Domain age matters less than content quality
The branded-mention finding is the one that reorders most people's priorities, because it inverts the usual advice: the thing that best predicts whether an AI engine cites you is how often the web talks about you, not how many links point at you. That is a fundamentally different game from classic SEO, and we pull the two apart in our comparison of AI-powered and traditional SEO methods.
How Much AI-Generated Content Ranks on Google?
- 13.08% of top-performing Google content is now AI-generated – up from just 2.3% before GPT-2. (Source: Influencer Marketing Hub)
- 67% of businesses report improved content quality when using AI. (Source: Semrush)
Both numbers point the same way, and neither says AI content ranks better. They say it ranks at all, in volume. The scarce input is no longer text.
What Is AI Adoption Among SEO Professionals?
- 86% of SEO professionals have integrated AI into their strategy. (Source: SeoClarity, 2025)
- 87% of marketers use AI to assist content creation. (Source: Ahrefs, 2025)
- 75% use AI to reduce time on manual tasks like keyword research. (Source: HubSpot, 2025)
Adoption is effectively settled. What it actually buys you is not. We put the two approaches side by side — cost, speed, conversion rate, and the places where manual work still wins — in AI SEO versus traditional methods. If the gap on your team is skill rather than tooling, our co-founder Emre Elbeyoglu completed six programs and ranked the best AI SEO courses on curriculum, measurement, and total cost.
What Are Consumer Attitudes Toward AI Search?
Adoption and trust are not the same thing, and the gap between them is where the opportunity sits.
- Users click a search result in only 8% of visits where an AI Overview appears, compared with 15% on visits without one. (Source: Pew Research, 2025)
- Only 1% click a link inside the AI summary itself. (Source: Pew Research, 2025)
- 116.9 million Americans use generative AI. (Source: eMarketer, 2025 estimate)
People are reading the answer and leaving. They are not, in any volume, following the citations. That means an AI citation is worth chasing for its brand impression, not for the click — and it changes what you should be measuring.
What ROI Can Businesses Expect from AI SEO?
- 68% of marketers attribute a higher content marketing ROI to AI. (Source: SEOprofy survey, 2026, reported via Yahoo Finance)
- AI content lifted SEO-driven organic traffic for online courses by 48% in one vendor case study. (Source: Zebracat, via SEOprofy)
Treat single-vendor case studies as directional, not as benchmarks. A 48% lift in one vertical, reported by the vendor whose product produced it, tells you the mechanism works — not what it will do for you.
How Should You Optimize for AI Search in 2026?
The statistics above converge on six moves. Each is expanded — with tooling, content structure and UX specifics — in our guide to optimizing for AI-driven search.
1. Check that AI crawlers can reach you
Before anything else, open your robots.txt. In our July 2026 scan, 46% of top sites blocked at least one AI crawler and 54% blocked none — and almost nobody in the second group had made that an active decision either. Both states should be deliberate.
Allowing a crawler is not the same as being served by it, though. The bots take far more than they give back: we break the exchange rate down in crawl-to-refer ratios for AI crawlers, and the split varies by market — see AI bot traffic by country. If you want to publish machine-readable guidance alongside robots.txt, llms.txt is the emerging convention, though adoption is still thin.
2. Prioritize AI Overview Citations
Focus on ranking in Google's top 10, as 76% of AI citations come from there. But don't ignore lower-ranking opportunities – a meaningful share of citations come from beyond page one.
3. Build Brand Mentions
Branded web mentions correlate 3x stronger with AI visibility than backlinks. Invest in PR, thought leadership, and earned media.
4. Optimize Content Structure
Use Q&A formats, clear headers, and structured data. AI systems prefer easily parseable content with direct answers.
The deeper shift is from matching keywords to matching meaning: topic clusters and named entities are what a model can actually resolve. See semantic search and contextual content for how to build both.
5. Track AI-Specific Metrics
Monitor referrals from ChatGPT, Perplexity, and other AI platforms. Track citation frequency, not just rankings. Rankings still matter — 76.1% of AI Overview citations come from the top 10 — so keep a rank tracker on the keywords that trigger an AI Overview, and read position and citation together rather than as rival metrics.
6. Balance Human and AI Content
AI can generate drafts and research, but human editing ensures brand voice and emotional resonance. The most successful content combines both. If you're putting a model to work on the research half, our library of SEO prompts for ChatGPT covers the tasks it handles reliably — and how to use ChatGPT for SEO is candid about the ones it doesn't.
One more behavioural shift belongs here, because it predates the current wave and is often mistaken for it: spoken queries are conversational, long, and question-shaped — the same shape assistants reward. The groundwork in voice search SEO transfers almost directly.
✅Do This Next: Fetch your own robots.txt and search it for GPTBot, ClaudeBot, PerplexityBot, OAI-SearchBot and Google-Extended. If any carries a Disallow you didn't consciously add, you are paying for content that the assistants are not allowed to read.
Methodology and Sources
Our first-party data. Three separate SEOmator sources appear in this article, and they are not interchangeable.
The 48-site robots.txt scan was a single run on 13 July 2026 across news, ecommerce, SaaS, SEO, reference, travel, finance, and health. A site counts as blocking a crawler only when that crawler has its own user-agent group carrying a non-empty Disallow. Two sites returned no parseable robots.txt. Sample size is 48 — large enough to show a pattern, too small to project onto the whole web, and we don't.
The wide scans are bigger and more defensible: 4,257 top-domain robots.txt files parsed by our crawler on 20 July 2026, and AI-readiness checks across 109,440 top domains on the same date.
The panel figures — AI share of bot traffic, the 4xx rejection rate, crawl purpose mix and our crawl-to-referral series — come from SEOmator crawling and analytics data, January–July 2026 (100K+ websites audited, 50M+ pages crawled, 50M+ users tracked monthly across 500+ sites with web analytics installed). Those shares describe the sites we monitor, not the internet: the panel is roughly 60% B2B SaaS, 20% e-commerce and 20% mixed, which is why our block rates run higher than the consumer web's. July figures cover 1–21 July. Every panel number in this article is dated to July 2026 and has not been re-dated forward.
robots.txt states intent, not enforcement: it does not prove a crawler obeyed, and it cannot tell you which bots actually hit your server. Server logs answer that — which is what agent analytics reads.
Cloudflare Radar data. The crawl-to-refer ratios, AI bot traffic shares, crawl-purpose split, web-scale robots.txt counts, the 107,002-domain agent-readiness scan and the markdown payload-reduction ratio are not ours. They come from Cloudflare Radar and are labelled as such everywhere they appear. What is ours is the analysis: which of these numbers change an SEO decision, in what order, and why. Source: Cloudflare Radar (radar.cloudflare.com) — bots/crawlers/summary/crawl_refer_ratio, ai/bots/summary/user_agent, ai/bots/summary/crawl_purpose, ai/markdown_for_agents/summary: 28-day window ending 2 September 2026, with the preceding 28 days used for the movement columns; robots_txt/top/user_agents/directive scan dated 31 August 2026; agent_readiness/summary/check scan dated 31 August 2026.
Three normalization notes, because they are easy to get wrong. The crawl-to-refer figure is a ratio (pages crawled per one referral returned), not a percentage — and it is unbounded, which is why Mistral, having returned no referrals in the window, reports as infinite rather than as a very large number. The robots.txt figures are raw counts of files, which we can now express as shares because Radar publishes the denominator (4,317 files parsed on 31 August); in our July edition it did not, and we said so. The agent-readiness figures are also raw counts, converted to shares against the 107,002 successfully scanned domains — and for the per-vertical table, against each category's own count, not the global total, which is the easiest mistake to make with that endpoint.
Why we publish someone else's numbers. We could not run a 107,002-domain scan of the live web, and pretending otherwise would be the fastest way to lose the only thing a statistics page is for. Cloudflare can see traffic we cannot. Where they have the better instrument, we cite them and say so. Where we have the better instrument — our own audit, crawl and analytics panel — we say that too, and we mark the boundary in both directions. Where both instruments point at the same thing, as they do on Anthropic's collapsing extraction ratio and on GPTBot leading the disallow list, we say that loudest, because independent agreement is worth more than either number alone.
What changed in this edition (2 September 2026). Every Cloudflare Radar figure was re-pulled and most had moved materially in seven weeks. Two claims reversed and are corrected in place: the crawl-to-refer ratios are not all falling (Anthropic halved, but OpenAI and Perplexity roughly doubled), and ClaudeBot is no longer the largest non-search AI crawler (Meta-ExternalAgent passed it). We have kept the July figures alongside the new ones rather than overwriting them silently.
When our data and Radar's disagree, Radar wins. That happened here. Our 48-site sample put ClaudeBot one site ahead of GPTBot; Radar's far larger robots.txt scan puts GPTBot clearly first. We retracted our ordering rather than defend a one-site gap, and left the correction visible at the top of the crawler section. A statistics article that quietly edits its own numbers is worth less than one that shows its work.
External statistics. Every third-party figure above carries a named source and a date. Where a widely-circulated statistic had no traceable original researcher, we removed it rather than repeat it. Where two credible sources disagree — zero-click rates, ChatGPT's market share, the share of AI citations coming from the top 10 — we've given the range and named the reason they disagree instead of picking the flattering number. Statistics sourced from competing SEO vendors are attributed to them by name; those links are nofollowed.
Conclusion
The data is clear: AI has fundamentally changed SEO in 2026. With 2 billion AI Overview users, 61% CTR drops, and AI traffic converting at 23x higher rates, ignoring AI optimization means leaving significant value on the table.
The single number to carry out of this article is Cloudflare Radar's crawl-to-refer ratio. Google takes about 5 pages for every visitor it sends you. Perplexity takes 885. The trade that built the open web — you may read my pages, you will send me readers — has not been renegotiated. It has been quietly voided, and the ratio is the receipt.
The second thing to carry out is that the receipt is reissued every month. When we published this article in July, Anthropic was the worst offender at 2,442 : 1 and Perplexity looked comparatively restrained at 226 : 1. Seven weeks later Anthropic has halved and Perplexity has quadrupled past it. Any AI-crawler policy you set from a statistic older than a quarter is being enforced against a market that has already moved.
The loudest lesson from our own July 2026 scan is quieter still: nearly half of the web's biggest sites have already decided, often by accident, whether AI engines are allowed to read them. Most SEO teams have never checked which side of that line they're on. And when we checked our own headline number against a bigger dataset, it did not survive — GPTBot, not ClaudeBot, leads the web-scale disallow list. Publish the correction; it is cheaper than the alternative.
The winners in this new market will be those who:
- Confirm AI crawlers can actually reach their content, before optimizing for them
- Optimize for both traditional rankings AND AI citations
- Build brand visibility across the web (not just backlinks)
- Create content that AI systems can easily parse and cite
- Track new metrics like AI referral traffic and citation frequency
Tools like SEOmator's AI SEO Assistant can help you adapt to these changes. The future of SEO is AI-powered – but success still depends on strategic, human-driven execution.
Related Resources:
Frequently Asked Questions
Which AI crawlers are blocked most often?
At web scale, GPTBot is the most-disallowed AI crawler: Cloudflare Radar's 31 August 2026 robots.txt scan records 696 of 4,317 parsed files disallowing it (527 of them a full block), ahead of ClaudeBot (618), CCBot (604), Google-Extended (572), Bytespider (551), meta-externalagent (494) and PerplexityBot (326). SEOmator's own crawl of 4,257 top-domain robots.txt files on 20 July 2026 found the same ordering, with GPTBot named in 773 files to ClaudeBot's 629. Our smaller hand-checked scan of 48 high-traffic sites found the two effectively tied — 10 and 11 sites, a one-site gap we do not read an ordering into at that sample size. Overall, 46% of those 48 sites blocked at least one AI crawler and 54% blocked none.
How many pages do AI crawlers take for every visitor they send back?
Per Cloudflare Radar (28-day window ending 2 September 2026), Perplexity crawls 885 pages for every one referral it sends back, Anthropic 823 and OpenAI 455; Mistral returned no measurable referrals at all. Traditional search sits in a different universe: Google is 5.2 : 1 and DuckDuckGo 1.7 : 1. This is a ratio, not a percentage. It means AI assistants take content at hundreds of times the rate at which they return readers — so plan for citations and brand impressions, not for sessions. Note that these move fast: Anthropic's ratio halved over the preceding 28 days while OpenAI's and Perplexity's roughly doubled, so re-check rather than quoting a figure from last quarter.
What are the most important AI SEO statistics for 2026?
The most critical statistics are: 2 billion monthly AI Overview users, 61% organic CTR drop with AI Overviews, 93% zero-click rate in AI Mode, 23x higher conversion rates from AI traffic, and ChatGPT's 64.5% share of AI chatbot usage (down from 86.7%). Two more that get less attention: Perplexity crawls 885 pages per referral returned and Anthropic 823, versus Google's 5.2 (Cloudflare Radar, September 2026), and AI bots made up roughly 34% of all bot traffic across the sites SEOmator monitors in July 2026, about double January's share — though part of that step reflects a June change in how we classify AI bots.
How much does AI Overview affect click-through rates?
AI Overviews reduce organic CTR by 61% (from 1.76% to 0.61%). Paid search sees an even larger 68% decline. However, being cited in an AI Overview increases your CTR by 35% compared to not being cited, and AI Overview CTR itself recovered from a 1.3% low in December 2025 to 2.4% in February 2026.
Why do zero-click statistics disagree so much?
Because they measure different things. 93% applies to Google's AI Mode, 43% to Google searches that show an AI Overview, and estimates for all Google searches range from 34% to 68% depending on whether clicks to Google's own properties count and which clickstream panel is used. Any single decimal figure for "the" zero-click rate is overstating the evidence.
Which AI traffic converts best?
AI-referred traffic converts at 14.2% compared to Google organic's 2.8%. AI referral visitors convert to signups at 1.66% vs 0.15% for organic – an 11x advantage. Some B2B SaaS companies report 6x-27x higher conversion rates.
What is GEO and why does it matter?
Generative Engine Optimization (GEO) is optimizing content for AI search engines like Google AI Overviews, ChatGPT, and Perplexity. The GEO market will grow from $886 million to $7.3 billion by 2031, with companies reporting 300-500% ROI within 6-12 months. It only works if the engines can crawl you — check robots.txt first.
How can I get cited in AI Overviews?
Focus on ranking in Google's top 10 (76% of citations), build branded web mentions (3x stronger correlation than backlinks), use Q&A content formats, ensure fast page loading, and create deep, well-structured content that AI can easily parse. And confirm you aren't blocking the crawler that would need to read it.