

· 14 min read
Core Web Vitals Assessment Failed? Fix LCP, INP & CLS
Slow mobile LCP is the single most-failed rule across the 100,000+ sites we audited in 2026. Find which metric failed, fix it, and pass the assessment.
Benchmark your site against real 2026 data: Cloudflare Radar crawl ratios, Web Almanac Core Web Vitals pass rates, and post-AI-Overview CTR — every figure sourced and dated.

Ben Kaiser · Principal Software Engineer, Microsoft
Most SEO benchmark posts share a common flaw: the numbers have no traceable origin. A figure appears in one article, gets quoted in a second, and by the tenth repetition it reads as established fact — with every citation pointing at another blog post rather than at a measurement.
This edition takes the opposite approach. Every number below carries a source, a date, and a methodology note. Where a widely-repeated benchmark could not be traced to a primary source, it has been removed rather than softened — and there is a section at the end documenting exactly what came out and why, including one figure that this report itself put into circulation.
Three datasets do most of the work here:
A benchmark is only useful if you know what population it describes. "Average site speed" across 16 million sites tells you very little about your e-commerce category; the Radar crawl ratios describe traffic across Cloudflare's network, not the whole web. Read the methodology lines — they are there deliberately.
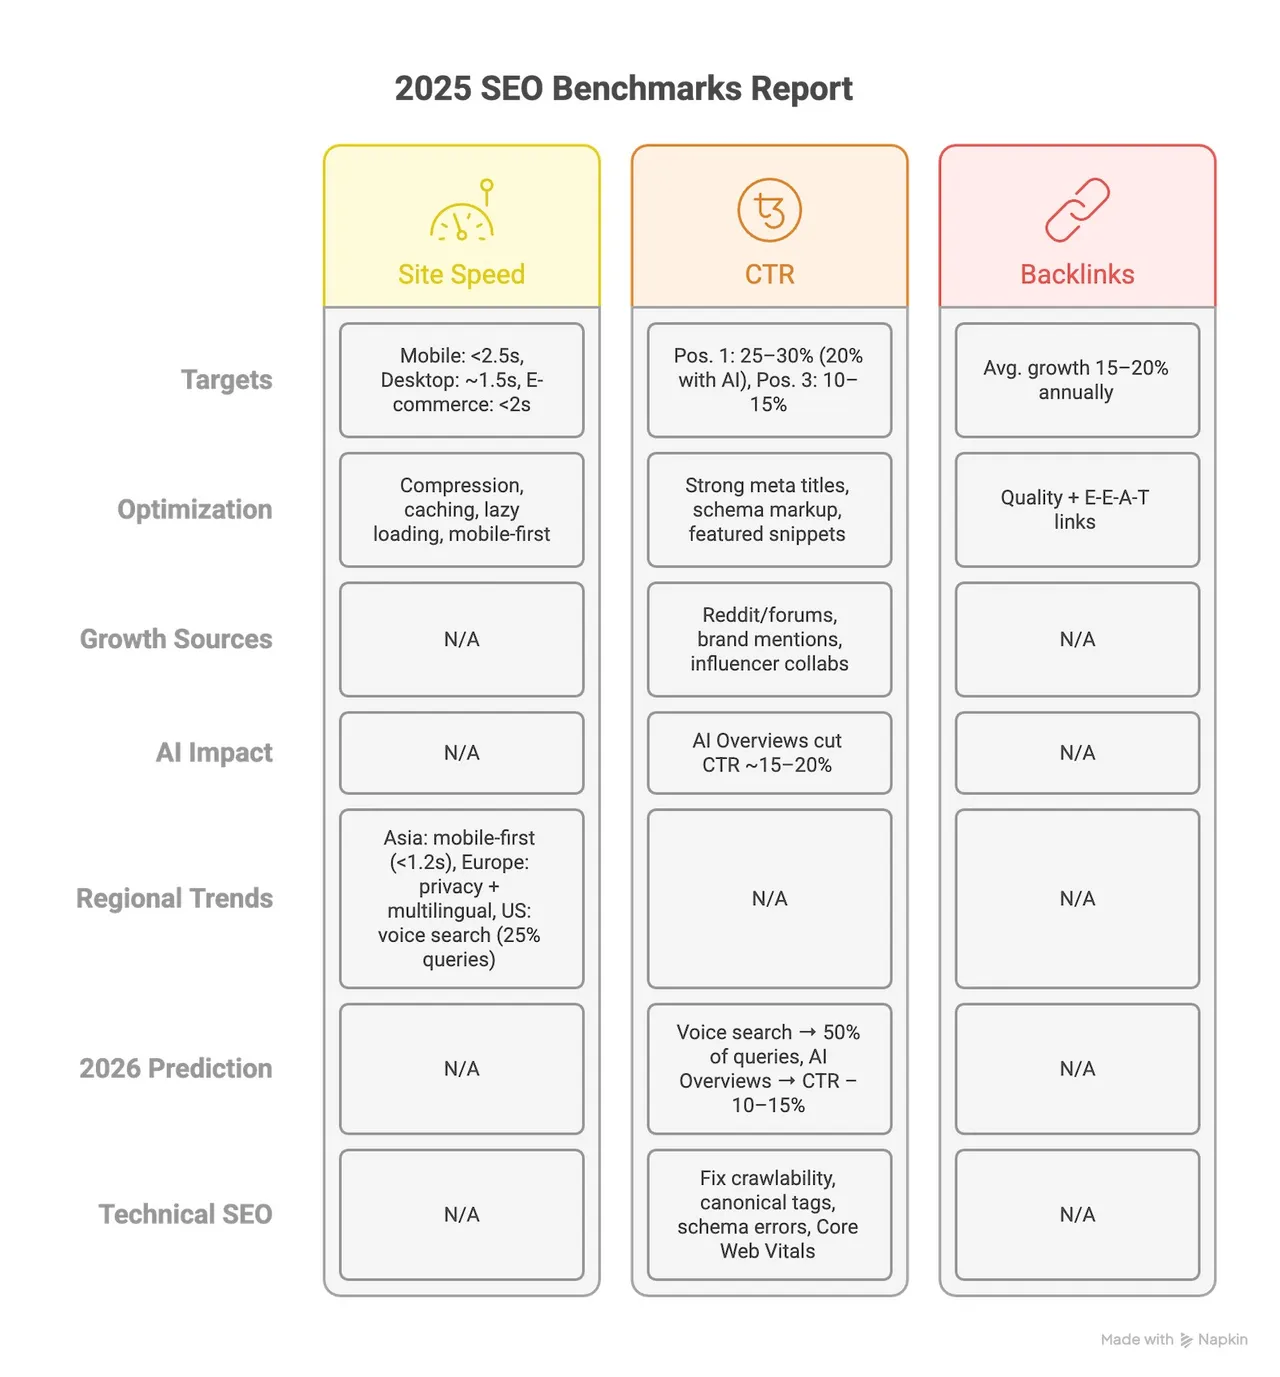
| Benchmark | Value | Source |
|---|---|---|
| Sites passing all Core Web Vitals (mobile) | 48% | Web Almanac 2025 (CrUX, July 2025) |
| Sites passing all Core Web Vitals (desktop) | 56% | Web Almanac 2025 |
| US Google searches ending without a click | 68.01% | SparkToro/Datos, Jan–Apr 2026 |
| CTR reduction for top result when AI Overview present | 58% | Ahrefs, Feb 2026 |
| Anthropic pages crawled per referral sent back | 2,299 : 1 | Cloudflare Radar, 28d to 19 Jul 2026 |
| Google pages crawled per referral sent back | 4.7 : 1 | Cloudflare Radar, 28d to 19 Jul 2026 |
| AI bot crawls whose declared purpose is model training | 46.73% | Cloudflare Radar, 28d to 19 Jul 2026 |
| Domains with robots.txt returning 200 | 84.9% | Web Almanac 2025 |
| Home pages with structured data | 50% | Web Almanac 2025 |
| Sites with hreflang (desktop) | 20.3% | Web Almanac 2025 — roughly doubled YoY |
This is the newest and least-benchmarked area in SEO, and the one where most teams have no baseline at all. Server logs answer it for your own site; Cloudflare Radar answers it for the network, which is what makes it a benchmark rather than an anecdote.
All figures in this section come from Radar's 28-day window, 21 June – 19 July 2026, unless noted otherwise.
Radar's crawl_refer_ratio measures how many pages an operator's crawlers fetch for every one referral it sends back. The benchmark number to hold onto: Google runs about 4.7:1, a roughly proportional exchange of crawl budget for traffic, while AI-native operators run two to three orders of magnitude less favorable — Anthropic and Mistral in the thousands-to-one range, OpenAI and Perplexity in the low hundreds.
Two cautions before benchmarking against it. These ratios are extremely unstable for exactly the operators people use them to judge — OpenAI's fell more than 75% and Mistral's rose roughly twentyfold across two consecutive 28-day windows, while every search engine stayed flat. And a referral is not the only value a crawl produces; a brand named in an AI answer with no link still reaches a buyer. The ratio measures traffic, not influence.
Our Crawl Waste Report 2026 has the full per-operator table with prior-window comparisons, plus the response-status data showing that verified AI bots actually receive a 200 more often than non-AI bots do. Use that as the deep dive; treat the 4.7:1 Google baseline as the benchmark.
| Bot | Share of AI-bot requests | Prior 28 days | Change |
|---|---|---|---|
| Googlebot | 24.56% | 26.38% | −1.82 |
| ClaudeBot | 18.66% | 16.88% | +1.77 |
| Meta-ExternalAgent | 11.20% | 11.08% | +0.12 |
| GPTBot | 9.73% | 9.36% | +0.37 |
| Bingbot | 8.62% | 7.97% | +0.65 |
| Bytespider | 6.72% | 8.21% | −1.49 |
| Applebot | 6.00% | 6.45% | −0.44 |
| Amazonbot | 5.89% | 5.25% | +0.64 |
| Claude-SearchBot | 3.44% | 3.01% | +0.43 |
Source: Cloudflare Radar, ai/bots/summary/user_agent, 28 days to 19 July 2026, compared against the preceding 28 days.
Across all bot traffic — not just AI agents — Radar's category breakdown puts search-engine crawlers at 26.19% and the three AI-related categories combined (AI crawler 17.75%, AI assistant 11.24%, AI search 6.56%) at roughly 35.5%. Dedicated SEO tools account for 11.82%. Bots overall are 34.45% of requests versus 65.55% human, essentially flat month over month.
Radar's crawl_purpose breakdown is blunt about intent: 46.73% of AI bot crawls declare training as their purpose, 39.19% are mixed-purpose, and only 11.00% are search. If your mental model is "AI crawlers are indexing me for citations," the data says that is the minority case.
The content-type split is more actionable:
| Content type | Share of AI bot fetches |
|---|---|
| HTML | 73.02% |
| JSON | 6.83% |
| JavaScript | 5.62% |
| Images | 5.41% |
| Plain text | 4.93% |
| XML | 1.76% |
| CSS | 1.41% |
Source: Cloudflare Radar, ai/bots/summary/content_type, 28 days to 19 July 2026.
Seventy-three percent HTML, 5.62% JavaScript. These crawlers are overwhelmingly reading server-rendered markup, not executing your application. That single ratio is the strongest available argument for server-side rendering as a 2026 requirement rather than a preference: content that only exists after hydration is, for three-quarters of this traffic, content that does not exist.
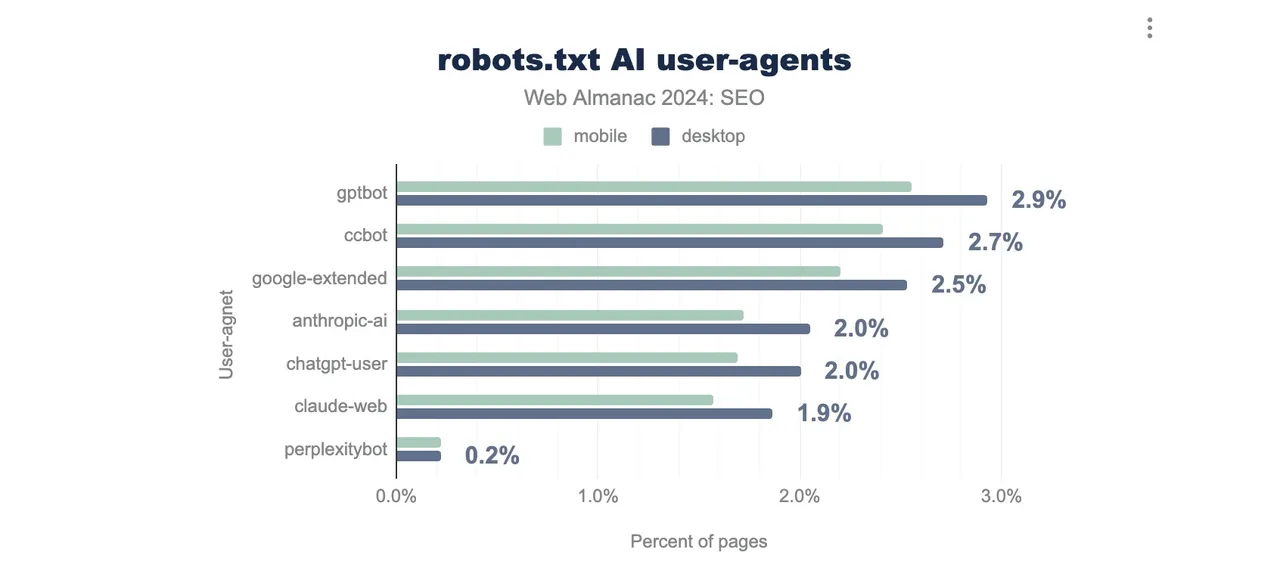
Radar's robots.txt dataset — a single-day snapshot of top domains, 13 July 2026 — gives one clean benchmark for how differently publishers treat AI crawlers versus search crawlers.
Among top domains, 460 fully disallow GPTBot. Only 27 fully disallow Googlebot. That roughly seventeen-fold gap is the number to benchmark your own policy against, and Googlebot is the control that makes it meaningful: its 279 partial disallows are ordinary path-level housekeeping (/cart, /admin), not AI policy. Publishers are not blocking crawlers in general. They are blocking one specific class, hard.
Whatever position you take, take it deliberately. A Disallow for GPTBot decides whether your content can appear in ChatGPT's answers; leaving it unset is equally a decision. The Crawl Waste Report carries the per-agent directive counts and the finding that these heavily-ruled-about crawlers are, in served reality, among the least blocked.
Radar's agent_readiness scan checked 107,308 domains on 13 July 2026 for the files and protocols AI agents look for:
| Check | Domains | Share |
|---|---|---|
| robots.txt present | 90,072 | 83.9% |
| robots.txt has AI-specific rules | 86,333 | 80.5% |
| XML sitemap | 74,258 | 69.2% |
| Link headers | 10,020 | 9.3% |
| Markdown content negotiation | 8,971 | 8.4% |
| Content signals | 7,250 | 6.8% |
| MCP server card | 260 | 0.24% |
| Web Bot Auth | 42 | 0.04% |
Source: Cloudflare Radar, agent_readiness/summary/check, scan of 13 July 2026.
Two things stand out. 30.8% of these domains have no sitemap at all — a 1998-era piece of technical hygiene, still unresolved on nearly a third of scanned sites. And the drop from 80.5% (has AI rules) to 8.4% (serves Markdown on content negotiation) marks the real frontier: the overwhelming majority of sites have decided whether to allow AI crawlers, and almost none have done anything to serve them well.
That gap is where competitive advantage currently sits, and it is cheap to claim.
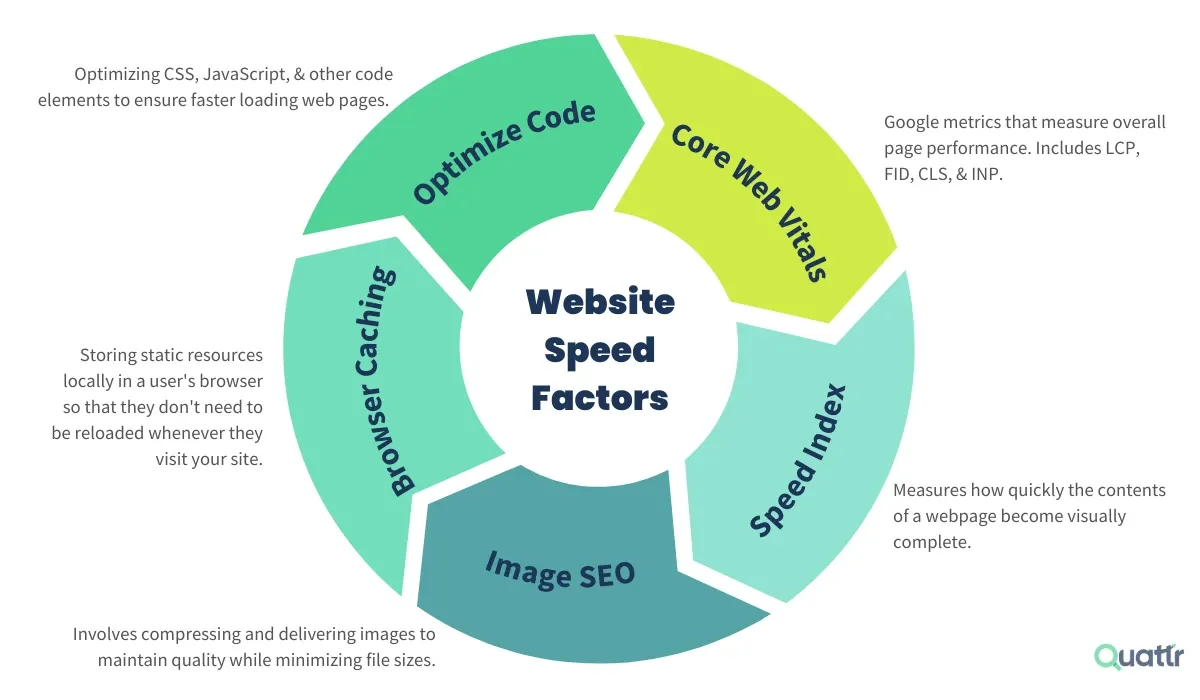
The Web Almanac's performance chapter draws on CrUX field data — real Chrome users, not lab simulations. These are the numbers to benchmark against, because they reflect what people actually experienced.
| Metric | Desktop | Mobile |
|---|---|---|
| All Core Web Vitals "good" | 56% | 48% |
| LCP good | 74% | 62% |
| CLS good | 72% | 81% |
| INP good | 97% | 77% |
Source: 2025 Web Almanac, Performance chapter, CrUX data, July 2025.
Read that table carefully, because two of its findings contradict conventional advice.
CLS is the one metric where mobile beats desktop — 81% versus 72%. Layout stability has been treated as a mobile problem for years; in the field data it is now more often a desktop one, typically from wide-viewport ad slots and late-loading sidebar modules that have no mobile equivalent.
INP is the mobile bottleneck, not LCP. Desktop INP passes at 97%; mobile at 77%. That 20-point spread is the largest device gap in the table, and it is a JavaScript execution problem — main-thread work that a laptop absorbs and a mid-range phone does not. Mobile INP did improve from 74% in 2024 to 77% in 2025, but it remains the metric most likely to be costing you a passing grade.
The popularity breakdown is the genuinely counterintuitive finding. On mobile, the top 1,000 sites pass all Core Web Vitals at 51%, the top 100,000 at just 37%, and the broader 10M at 48%. And the top 1,000 sites reach only 63% good INP — meaningfully worse than the web-wide 77%. The most popular sites on the internet ship the most JavaScript. If you have been benchmarking against "sites like ours, but bigger," you may have been calibrating to a worse target than the average.
The claim that "a 1-second delay drops conversions by 7%" is real and correctly attributed — to the Aberdeen Group, December 2008. It was a survey of 160+ IT organizations, published before mobile-first anything. Seventeen years on, it should not be cited as a current benchmark.
The defensible modern replacement is Deloitte and Google's "Milliseconds Make Millions" (2020): a 0.1-second mobile speed improvement produced +8.4% retail conversions, +9.2% average order value, and +10.1% travel conversions. Methodology: 37 European and American brand sites, 30M+ user sessions, hourly load-time monitoring across 30 days in late 2019.
The practical difference matters. Aberdeen framed speed as loss avoidance at the scale of whole seconds. Deloitte measured gains at the scale of hundreds of milliseconds — which is the range most already-decent sites are actually operating in, and where most remaining optimization work lives.
Site speed benchmarks are meaningless without the connection context. Radar's Internet Quality Index uses a deliberately conservative estimate of typical connections:
| Market | Median bandwidth (Mbps) | Median latency (ms) |
|---|---|---|
| Global | 12.77 | 74.85 |
| United States | 20.50 | 33.73 |
| Germany | 25.44 | 23.58 |
| India | 8.99 | 56.51 |
| Japan | 28.68 | 21.79 |
Source: Cloudflare Radar, quality/iqi/summary, 28 days to 19 July 2026, p50 values.
A methodological warning worth repeating: Radar also publishes speed-test medians (120.38 Mbps globally) from its fixed 90-day window, 20 April – 19 July 2026 — that endpoint ignores date-range parameters entirely. IQI medians and speed-test medians differ by roughly 10x because they measure different populations: IQI estimates typical connections, speed tests capture self-selected users deliberately benchmarking. Never present the two as the same metric. A great deal of "average internet speed" content does exactly that.
The global median of 12.77 Mbps is the number to design against. It is not the connection your development machine has.
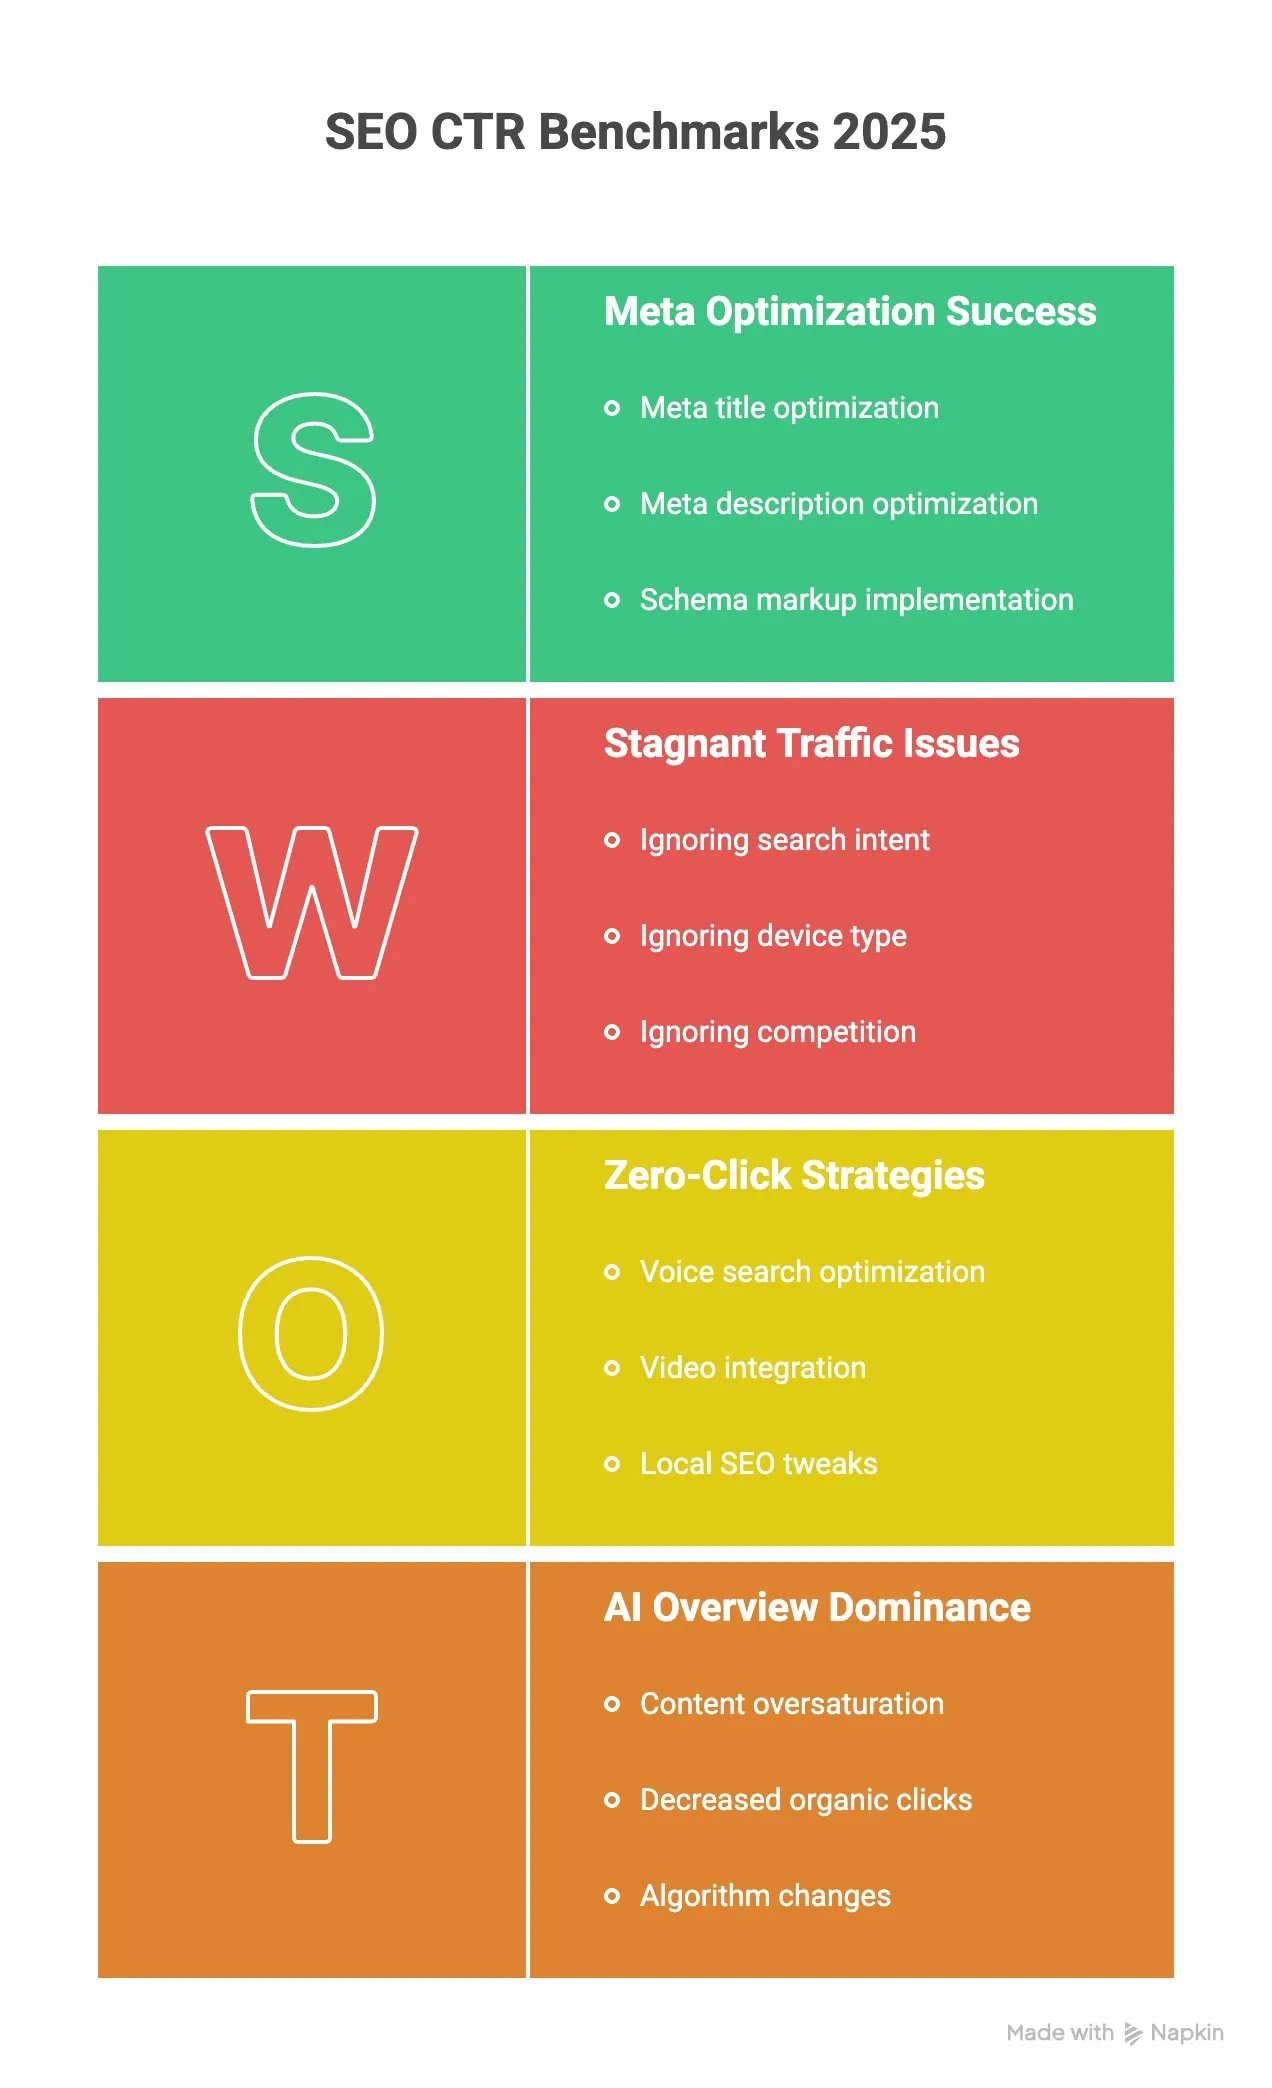
This is the most volatile area in the report, and the one where citing a single frozen number will make you wrong. The honest presentation is the trajectory.
68.01% of US Google searches ended without a click, January–April 2026, per SparkToro's analysis of Datos and Similarweb clickstream data (published 9 June 2026). The trend line: ~45% in 2016, ~49% in 2019, 60.45% in 2024, 68.01% in 2026.
Methodology caveat, which SparkToro states plainly: the panel is weighted two-thirds mobile and one-third desktop, a mobile session end is defined as 10 seconds of inactivity, and Google's mobile app is excluded — so the true figure is likely higher. Similarweb's parallel writeup puts the device split at roughly 45.2% zero-click on mobile against ~80% on desktop.
| Source | Finding | Sample | Published |
|---|---|---|---|
| Pew Research Center | 8% click a traditional result with an AI summary vs 15% without | 900 US adults, 68,879 searches | Jul 2025 |
| Ahrefs | 58% lower CTR for top result when AIO present | 300,000 keywords | Feb 2026 |
| Seer Interactive | 3.82% organic CTR without AIO vs 2.36% with | 53 brands, 5.47M queries | Apr 2026 |
| Amsive | −15.49% overall; −19.98% non-branded; +18.68% branded | 700,000 keywords, 10 sites | Apr 2025 |
The Pew study is the most methodologically robust, because it observed real browsing behavior rather than aggregating panel keyword data. It also found that only 1% of visits produced a click on a link inside the AI summary, and that session abandonment rose from 16% to 26% when a summary appeared.
Two findings in this table complicate the simple "AI Overviews are killing clicks" narrative, and a credible benchmarks report should carry both.
The effect has been getting worse, fast. Ahrefs measured a 34.5% CTR reduction in April 2025 and 58% by February 2026 — the impact roughly doubled in eight months. Any figure you cite from early 2025 is now substantially understated.
But it is not monotonic, and it is not universal. Seer's data bottomed out at 1.31% CTR with AIO in December 2025 and has since recovered to 2.36%. And Amsive found branded keywords gained 18.68% CTR when an AI Overview appeared. Seer also found that being cited inside the AI Overview produces 120% more organic clicks per impression than not being cited — though still 38% fewer than a query with no AIO at all.
The strategic reading: AI Overviews compress informational, non-branded, mid-position traffic hardest. Brand strength is a genuine hedge, and citation inside the Overview is worth pursuing even though it does not restore the pre-AIO baseline.
The most-cited position curve — position 1 at 28.5%, position 2 at 15.7%, position 3 at 11%, position 10 at 2.5% — comes from Sistrix's July 2020 study of 80M+ keywords. It has real methodology behind it, and it is entirely pre-AI-Overview. Treat it as a historical baseline, never as a 2026 target.
Sistrix's more durable finding is the variance: position 1 ranged from 13.7% to 46.9% depending on intent and SERP layout, hitting the high end when sitelinks appeared. The spread within a single position exceeded the gap between positions. That was true in 2020 and is more true now.
Advanced Web Ranking's Q1 2026 data adds the finding that should change how you report CTR: desktop and mobile are moving in opposite directions. Desktop positions 1–5 gained a combined +10.54 percentage points quarter over quarter, while mobile position 1 lost 2.20 points. A blended CTR benchmark now averages two divergent trends into a number describing neither. Segment by device or do not report it.
Be especially wary of the precise-looking position tables that circulate without sample sizes or methodology — figures like "position 1 = 27.6%" from sources that publish no data behind them, and that contradict themselves across their own pages. Precision is not accuracy.
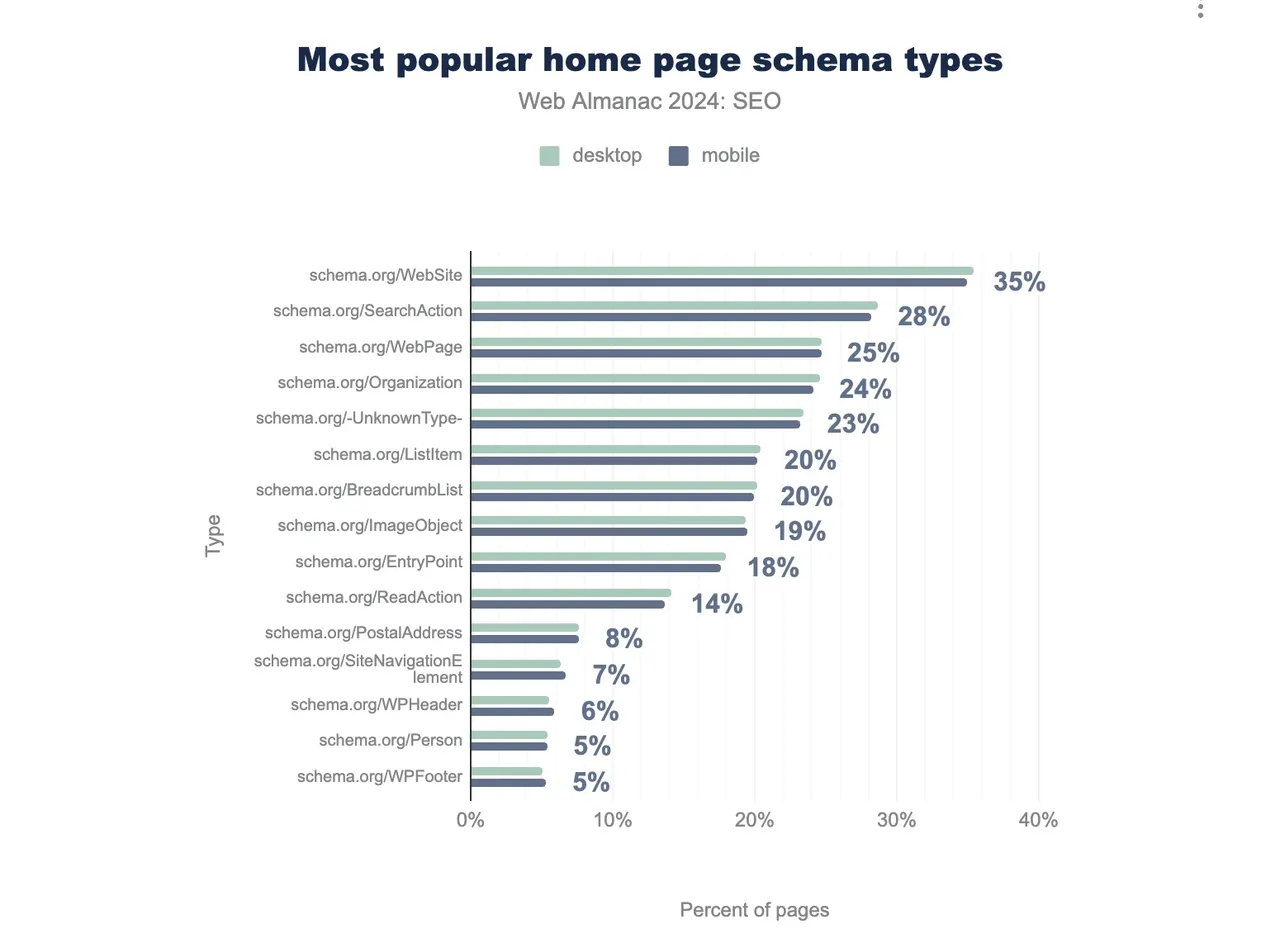
These figures describe what the web actually does, which is the only meaningful benchmark for whether your implementation is ahead or behind. All from the 2025 Web Almanac's SEO chapter, July 2025 crawl, 16.2M sites.
| Signal | 2025 | 2024 |
|---|---|---|
| robots.txt returning 200 | 84.9% | 83.9% mobile / 83.5% desktop |
| Structured data on home pages | 50% | 48% desktop / 49% mobile |
| hreflang | 20.3% desktop / 19.7% mobile | 10% desktop / 9% mobile |
| HTTPS (all pages) | 91.7% desktop / 91.5% mobile | 89% / 88.9% |
| Canonical tag present | 68% desktop / 67% mobile | — |
hreflang roughly doubled year over year — from ~9–10% to ~20%. It is the largest single movement in the 2025 edition and the clearest signal that international SEO stopped being a specialist concern.
On structured data: JSON-LD now appears on 43% of home pages (up from 40–41%), Microdata on 17% desktop, RDFa on 1%. Only 2% of sites inject structured data via JavaScript — worth knowing given the 5.62% JavaScript fetch rate among AI crawlers above. The most common home-page types are WebSite (37%), SearchAction (28%), Organization (26.7%), WebPage (25%), and BreadcrumbList (21%).
Two robots.txt details worth having: 404s fell to 13% from 14% in 2024, and only 0.1% of files exceed Google's 500 KB parse limit. If you are worried about your robots.txt size, you almost certainly should not be.
One artifact to know before you quote HTTPS figures: home pages sit at 84.6% desktop / 86.6% mobile, lower than inner pages at 92.4% / 93.4%. Radar's network-level view puts HTTPS at 94.56% of requests over the 28 days to 19 July 2026, with TLS 1.3 and QUIC together accounting for ~93.9% of TLS connections. The measurement layer changes the number; state which one you mean.
Radar's protocol mix for the same window: HTTP/2 at 52.13%, HTTP/1.x at 27.89%, HTTP/3 at 19.97%, with IPv6 at 29.20%. HTTP/3 approaching a fifth of traffic is the number to benchmark your infrastructure against.
The single most common benchmarking error is applying a global average to a specific market. Radar's device split, over the 28 days to 19 July 2026:
| Market | Desktop | Mobile |
|---|---|---|
| Global | 60.28% | 39.64% |
| United States | 70.16% | 29.75% |
| Germany | 70.55% | 29.42% |
| India | 41.74% | 58.23% |
| Japan | 44.40% | 55.60% |
Source: Cloudflare Radar, http/summary/device_type.
This is measured by request share across Cloudflare's network, which skews differently from consumer-only panels — but the relative picture is the point. India and Japan are majority-mobile; the US and Germany are 70% desktop. A "mobile-first" mandate calibrated on Indian traffic is simply wrong for a German B2B site, and vice versa. Combine this with the CWV device gap (48% mobile vs 56% desktop passing) and the INP spread, and your optimization priority should follow your actual market mix.
Browser and OS context for the same window: Chrome 70.88%, Safari 15.85%, Edge 5.76%, Firefox 4.19%; Android 34.79%, Windows 34.25%, iOS 17.09%, macOS 9.85%.
SEOmator.com
This section is deliberately short, because the honest answer is that there is no credible public benchmark for backlink growth rate, and previous editions of this report claimed otherwise.
What actually exists with disclosed methodology is Ahrefs' backlink growth study (18 September 2018): top-ranking pages gained followed referring domains at +5% to +14.5% per month. Note the unit — monthly, which compounds to far more than any annual figure commonly quoted. The sample was 10,000 non-branded US keywords at 2–5K volume across 200,000 pages over three months, and Ahrefs explicitly cautions that correlation is not causation. It is also seven years old.
Everything else available is vendor content quoting absolute counts ("5–15 new referring domains per month") with no disclosed sampling.
The defensible position: benchmark your referring-domain growth against your own trailing twelve months and against named competitors in your niche, not against an industry average that does not exist. Directional questions — is velocity increasing, is the referring-domain-to-page ratio improving, are new links from previously-unseen domains — are answerable from your own data and actually decision-useful. An invented industry constant is neither.
Three claims from previous editions were removed rather than updated. Documenting removals is unusual, but a report arguing for sourced benchmarks should be auditable on its own history.
"Backlink growth averages 15–20% annually." No primary source exists. During verification, search engines returned this report as the authority for the figure — meaning a number this post published without a source is now being cited back as independent confirmation of itself. That is citogenesis, and this edition retracts it. See the backlinks section above for what is actually measurable.
"Voice search will reach 50% of queries." This traces to a September 2014 Fast Company interview with Andrew Ng, then Chief Scientist at Baidu, who predicted that within five years "at least 50% of all searches are going to be either through images or speech." Three distortions occurred in transmission: it described Baidu and the Chinese market rather than global search, it counted images and speech combined rather than voice alone, and its five-year horizon expired in 2019. It is frequently attributed to Comscore, which never published it. The related "25% of US queries are voice" claim is equally untraceable — no large-scale public measurement of voice search share exists, and Google has never released one. Both are removed. Brodie Clark documented the misattribution chain in detail.
Five Web Almanac figures (52% robots.txt, 68% sitemaps, 44% structured data, 18% hreflang, 85% HTTPS) did not match the Web Almanac's published numbers for either 2024 or 2025. All five have been replaced with sourced 2025-edition figures in the technical adoption section.
A benchmark you cannot trace is not a benchmark. It is a rumor with a decimal point.
Benchmarks are diagnostic instruments, not targets. The value is in the gap between a figure and your own measurement, and in knowing which gaps are worth closing.
To measure your own site against these baselines, the SEOmator SEO audit tool covers the technical and Core Web Vitals side, and the GEO audit tool covers AI crawler access and citability. For the network-level figures, Cloudflare Radar is free and queryable directly — every Radar number in this report can be reproduced from the endpoints cited alongside it.
A benchmark's worth is set by its methodology, not its precision. Prefer a sourced range to an unsourced decimal.
Reproducibility note. Cloudflare Radar figures were pulled on 19 July 2026. Windows differ by endpoint family: http/*, bots/* and ai/bots/* use the 28 days to 19 July 2026; robots_txt/* and agent_readiness are single-day snapshots from 13 July 2026; quality/speed/* returns a fixed 90-day window (20 April – 19 July 2026) regardless of the range requested. Radar values shift daily — re-pull before republishing any figure here.
Who wrote it, what changed and how to tell us about a mistake.

Ben Kaiser
Principal Software Engineer, Microsoft
Ben Kaiser is a Principal Software Engineer at Microsoft, based on the Gold Coast, Australia. He has spent most of the past decade at Microsoft leading front-end teams behind products used by millions — the Azure.com pricing calculator, and the OneDrive and Microsoft Lists progressive web apps — with a consistent focus on web performance and architecture at scale.
He writes for SEOmator about the engineering side of technical SEO: Core Web Vitals, JavaScript rendering, and the front-end decisions that determine how fast a page loads and how cleanly search engines and AI answer engines can crawl it. He holds a Master's in Computer Software Engineering from the University of Melbourne, and was a Grand Prize winner of Google Code-in 2013, completing 46 tasks for the KDE project. On his own blog he writes about where software engineering is heading — most recently on AI-first application development, and before that MCP-first application development.
Published
Spot a mistake or a number that has gone stale? Tell us. We correct it and log the change in the History above. Report an error →
SEOmator Rank Tracker
Technical fixes are invisible until positions move. Track the keywords a fix was meant to affect and watch whether it actually landed.
SEOmator Rank Tracker· 14 min read
Slow mobile LCP is the single most-failed rule across the 100,000+ sites we audited in 2026. Find which metric failed, fix it, and pass the assessment.

· 16 min read
Only 45.9% of crawler requests return a 200. The 2026 crawl waste report breaks the waste down by client type, industry, and operator — and finds AI bots are the cleanest traffic on the web, not the dirtiest.

· 20 min read
Perplexity now crawls 2,373 pages for every referral it sends back, up from 112 in January. Anthropic fell from 47,779:1 to 549:1, and Mistral sent no measurable referrals at all. Cloudflare Radar's crawl-to-refer ratios, month by month to September 2026.


