SEOmator's July 2026 AI crawler report: ClaudeBot's share of the AI-bot user-agent mix on the sites we track jumped from 10.7% in May to 22.4% in June 2026, then eased back to 19.2% in July (Jul 1-21), while Meta-ExternalAgent rebounded from 10.7% to 12.7%. Cloudflare Radar's global months show the same surge and cool at a smaller amplitude.
Key takeaways from the July 2026 AI crawler report:
- ClaudeBot: 10.7% (May) → 22.4% (June) → 19.2% (July 1-21, 2026) of the AI-bot mix across the sites we track. Globally on Cloudflare Radar: 9.9% → 19.8% → 16.5%, then 11.7% in August.
- Meta-ExternalAgent: 10.7% (June) → 12.7% (July 1-21) on our panel; 10.2% → 12.5% → 13.9% (August) globally.
- Google's operator share on our panel: 42.6% (January 2026) → 30.8% (July 1-21). Globally: 37.3% → 27.1%. Anthropic out-crawls OpenAI in both datasets every month since June.
- Training-purpose crawling: 39.1% (January) → 46.1% (July 1-21) of AI-bot hits on our panel, vs 44.7% globally in July. In August the global share fell to 40.0% as search-purpose crawling jumped to 17.2%.
- 36.4% of crawler requests were rejected with a 4xx across the sites we monitor in July 2026 (Jul 1-21); 34.7% globally. Deliberate 403s alone were 21.4% of all crawler requests worldwide.
- GPTBot appears in 773 of the 4,257 robots.txt files we parsed on July 20, 2026, the most-named agent, ahead of ClaudeBot (629).

Who operated the most bot traffic in July 2026?
Google still operates more bot traffic than anyone else on the sites we track, and it keeps giving ground anyway. Google's operator share on our panel fell from 42.6% in January 2026 to 30.8% in July (Jul 1-21). That's nearly twelve points surrendered in seven months, and no single rival picked them up. The crawl mix fragmented instead: the points spread across Anthropic, Amazon, and a long tail of smaller agents.
| Operator | Panel, Jan | Panel, Jul* | Radar, Jan | Radar, Jul | Radar, Aug† |
|---|
| Google | 42.6% | 30.8% | 37.3% | 27.1% | 26.4% |
| Meta | 13.5% | 12.2% | 15.1% | 14.6% | 18.9% |
| Anthropic | 14.1% (Jun) | 12.7% | 12.7% (Jun) | 11.0% | 8.5% |
| OpenAI | 9.7% | 7.4% | 9.2% | 6.5% | 5.7% |
| Microsoft | 7.2% | 6.2% | 6.5% | 5.5% | 5.0% |
| Amazon | 3.2% | 4.3% | 3.6% | 4.7% | 4.9% |
* Panel figures for July 2026 cover July 1-21 (partial month). † Cloudflare Radar, share of global bot traffic by operator, calendar months of 2026; August covers Aug 1-28. Anthropic enters both series in June 2026, when Radar's bot taxonomy expanded (our panel mirrors that taxonomy), so its first column shows June.
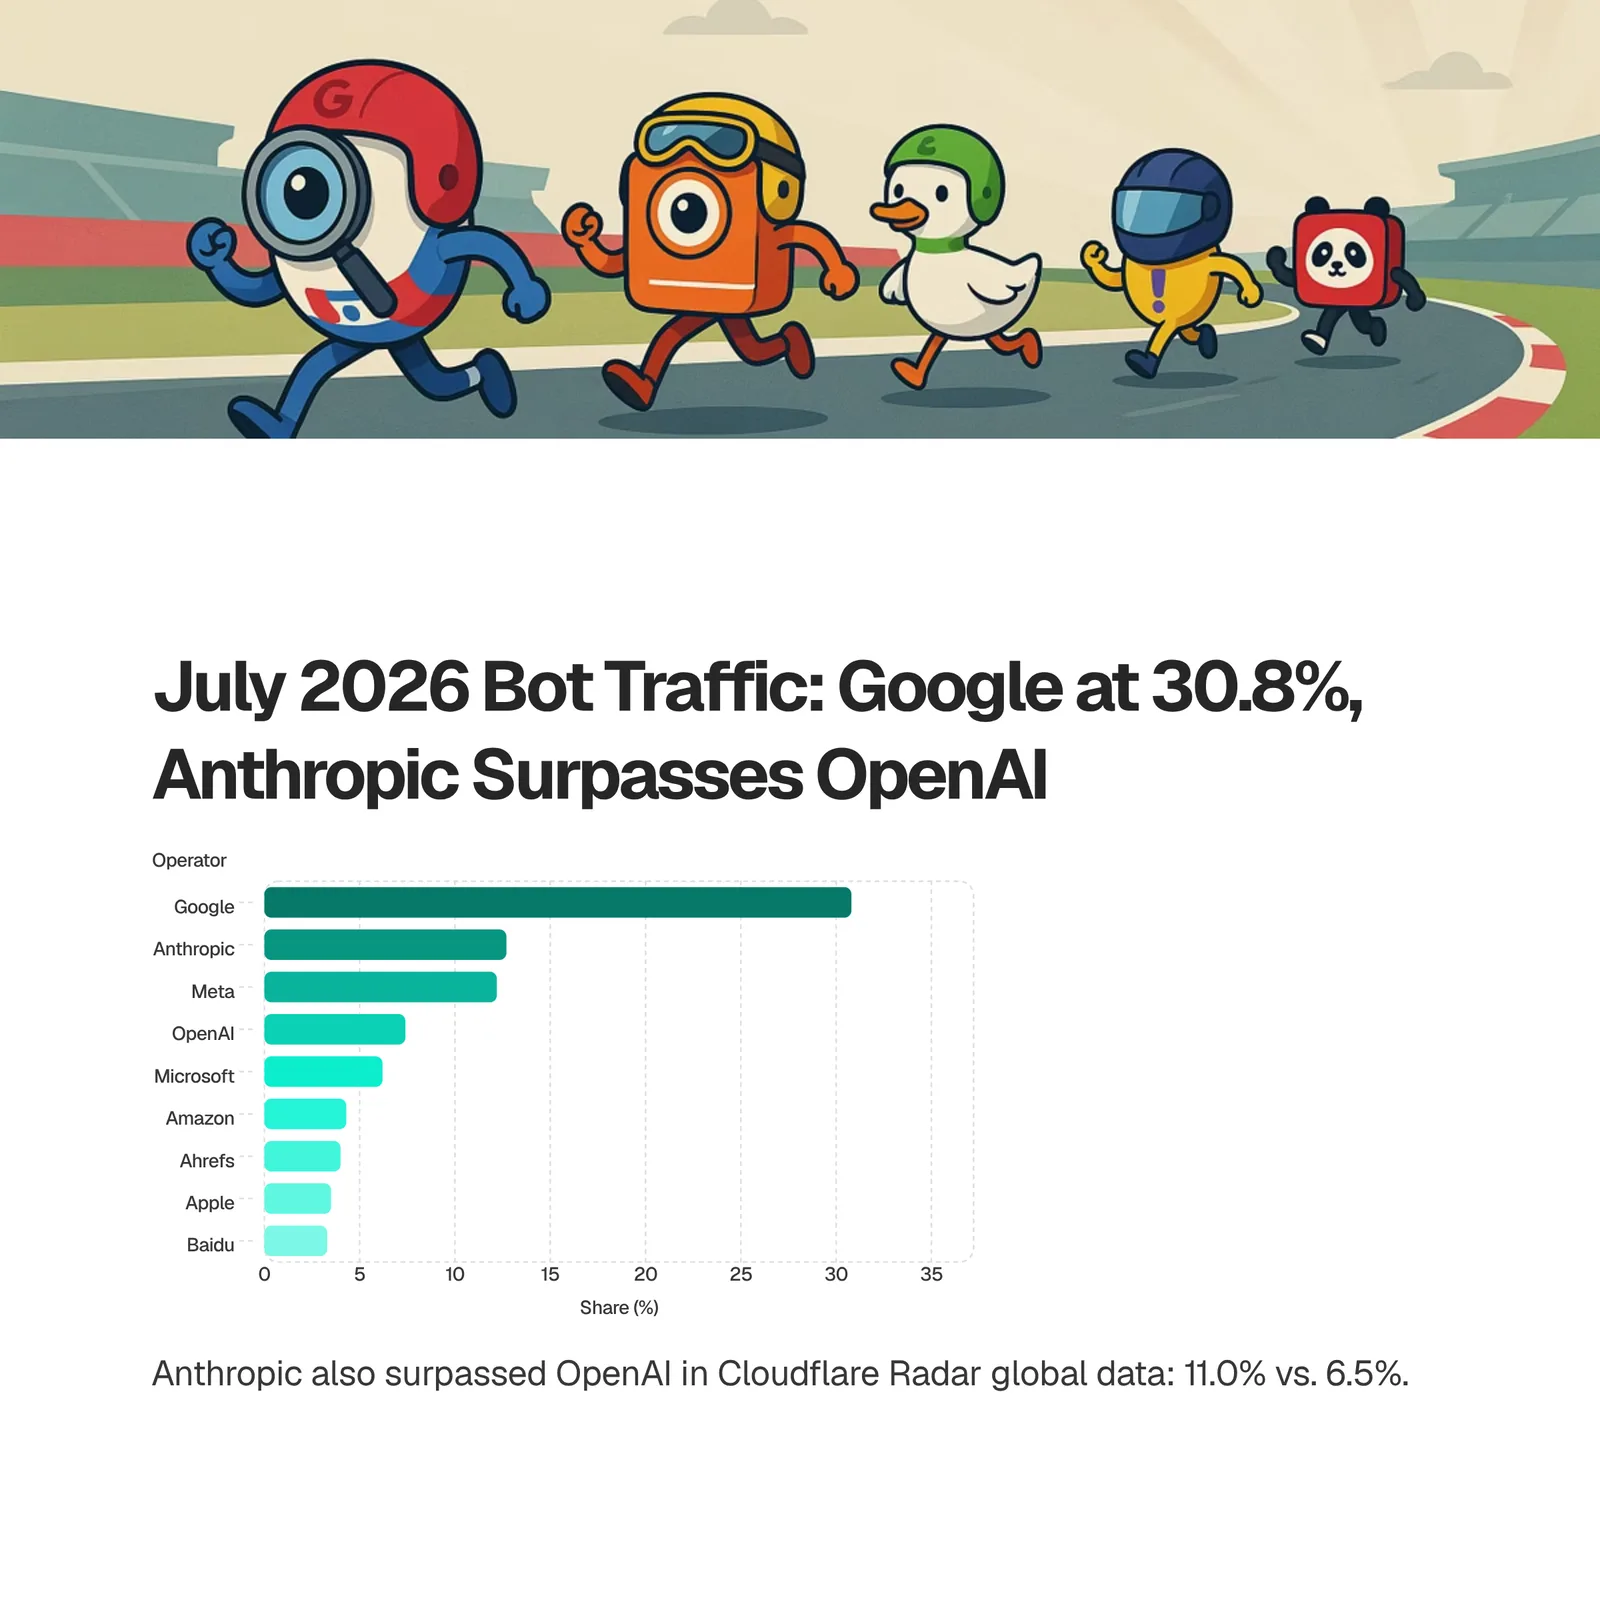
The global picture rhymes, month for month. Google went from 37.3% of worldwide bot traffic in January to 27.1% in July on Cloudflare Radar: a ten-point slide against our panel's twelve. Same slope, and our panel starts five points higher; the likeliest reason is our B2B tilt, since software companies live and die by Google Search. Anthropic has out-crawled OpenAI in both datasets every month since it appeared: 12.7% against 6.9% globally in June, 11.0% against 6.5% in July. The scale behind those shares keeps growing, too: according to Cloudflare Radar data shared by CEO Matthew Prince on June 3, 2026, bots now generate 57.5% of HTML web traffic.
📊By the Numbers: Google's share of bot traffic hitting the sites we track fell from 42.6% in January to 30.8% in July 2026. Anthropic (12.7%) now operates more bot traffic than OpenAI (7.4%) on our panel.
That Anthropic out-crawls OpenAI, on business sites and globally, still reads as a surprise. It shouldn't by now.
August's early global read belongs to Meta: 18.9% of worldwide bot traffic on Radar for Aug 1-28, its highest share of the year, while Anthropic slipped to 8.5%. Whether our panel follows is the first thing the August edition will check.
Drill from operators down to individual bots and the diversification sharpens. Googlebot alone accounted for about 21% of all bot hits on our panel in January 2026; by July (Jul 1-21) it was down to about 12.5%. And since June, the #2 individual bot we see isn't a search crawler at all. It's Claude-User, the agent that fetches a page because a human asked Claude a question. It ran at roughly 10-11% of bot hits on our panel in June and July. Bigger than GPTBot. Where that agent traffic originates varies widely by geography; we mapped that in our breakdown of AI bot traffic by country.

ClaudeBot is July's headline, and the move is downward. Anthropic's training crawler more than doubled its share of the AI-bot user-agent mix on our panel between May and June 2026 (10.7% to 22.4%), then gave part of it back, easing to 19.2% in July (Jul 1-21).
| AI bot user agent | May | Jun | Jul* |
|---|
| Googlebot | 27.7% | 26.0% | 25.5% |
| ClaudeBot | 10.7% | 22.4% | 19.2% |
| Meta-ExternalAgent | 13.8% | 10.7% | 12.7% |
| GPTBot | 11.5% | 9.2% | 9.9% |
| Bytespider | 9.7% | 7.1% | 5.4% |
| Claude-SearchBot | 2.5% | 3.7% | 3.9% |
* Share of the AI-bot user-agent mix on our panel; July 2026 covers July 1-21 (partial month).
Cloudflare Radar's global months trace the same curve one notch lower:
| AI bot user agent | May | Jun | Jul | Aug† |
|---|
| Googlebot | 27.5% | 25.2% | 24.5% | 22.3% |
| ClaudeBot | 9.9% | 19.8% | 16.5% | 11.7% |
| Meta-ExternalAgent | 13.4% | 10.2% | 12.5% | 13.9% |
| GPTBot | 11.2% | 9.4% | 9.7% | 8.2% |
| Bytespider | 10.1% | 7.6% | 5.3% | 3.7% |
| Claude-SearchBot | 2.1% | 3.3% | 3.5% | 3.6% |
† Cloudflare Radar, global AI-bot user-agent shares, calendar months of 2026; August covers Aug 1-28. Radar's "other" bucket jumps from 6.6% to 14.2% in August, so treat the August column as provisional.
So the surge-and-cool is a global event, not a quirk of the sites we track. ClaudeBot doubled worldwide between May and June (9.9% to 19.8%), cooled to 16.5% in July, and by August was back at 11.7%, within a rounding error of where it started the year (11.8% in January). Our panel peaked higher (22.4% against 19.8%) and had cooled less by the 21st of July. Two datasets, one shape.
I can't see Anthropic's crawl scheduler, but I've built enough crawlers to recognize the shape of this curve: a doubling in thirty days followed by a partial retreat usually means a bulk re-crawl cycle finishing, not a permanent step-change in appetite. Radar's August number settles it for me. 11.7% is January's level. That was a cycle, and it's over.
Meta is the counter-move. Meta-ExternalAgent went from 10.7% of the AI-bot mix on our panel in June to 12.7% in July (Jul 1-21); globally it went 10.2% to 12.5%, then on to 13.9% in August. Share math matters here: user-agent shares are zero-sum, so ClaudeBot's June surge mechanically squeezed everyone else, and part of Meta's July gain is ClaudeBot exhaling. Not all of it, though. Meta's operator share rose on our panel (11.4% to 12.2%, June to July) and jumped globally in August (14.6% to 18.9%). Meta's appetite predates this report: Fastly's Q2 2025 Threat Insights research already had Meta generating more than half of the AI crawler traffic it observed in mid-2025, more than Google and OpenAI combined.
📈Trend Watch: Googlebot held 38.7% of the AI-bot user-agent mix on our panel in January 2026 and 25.5% by July (Jul 1-21). Globally on Cloudflare Radar: 38.5% in January, 22.3% in August. The crawl economy is steadily diversifying away from one dominant bot.
Two quieter moves round out the month. GPTBot kept drifting down on our panel, from 12.6% of the AI-bot mix in January 2026 to 9.9% in July (Jul 1-21), and globally from 12.6% to 8.2% by August; Radar confirms the ClaudeBot-over-GPTBot ordering in every month since June. Bytespider ran the ClaudeBot movie a month early: a May spike to 10.1% globally (9.7% on our panel), then a slide to 3.7% by August. Meanwhile Claude-SearchBot, Anthropic's citation crawler, arrived at 3.9% of the mix on our panel in July, nearly matching its 3.5% global share in its first months as a measurable presence.
⚠️Common Mistake: ClaudeBot and Claude-SearchBot are different bots with different jobs. ClaudeBot gathers training data; Claude-SearchBot fetches pages to cite in answers. A robots.txt rule that blocks both costs you citations, not just training exposure.
What are AI crawlers doing with your content?
Mostly, training models on it. And that's true everywhere, not only on business sites. Training-purpose crawling rose from 39.1% of AI-bot hits across the sites we track in January 2026 to 46.1% in July (Jul 1-21), after peaking at 47.3% in June. Cloudflare Radar's global July reads 44.7%, up from 39.0% in January. Search-purpose crawling climbed from 8.3% to 12.4% on our panel over the same stretch, and from 7.4% to 11.6% globally.
| Purpose | Panel, Jan | Panel, Jul* | Radar, Jan | Radar, Jul | Radar, Aug† |
|---|
| Training | 39.1% | 46.1% | 39.0% | 44.7% | 40.0% |
| Search | 8.3% | 12.4% | 7.4% | 11.6% | 17.2% |
| User action | 2.1% | 2.5% | 2.2% | 2.6% | 5.2% |
| Mixed purpose | 50.0% | 38.3% | 50.9% | 39.9% | 35.9% |
* Panel figures for July 2026 cover July 1-21 (partial month). † Cloudflare Radar, global crawl-purpose shares, calendar months of 2026; August covers Aug 1-28. Columns don't sum to exactly 100%: the small remainder is undeclared-purpose crawling.
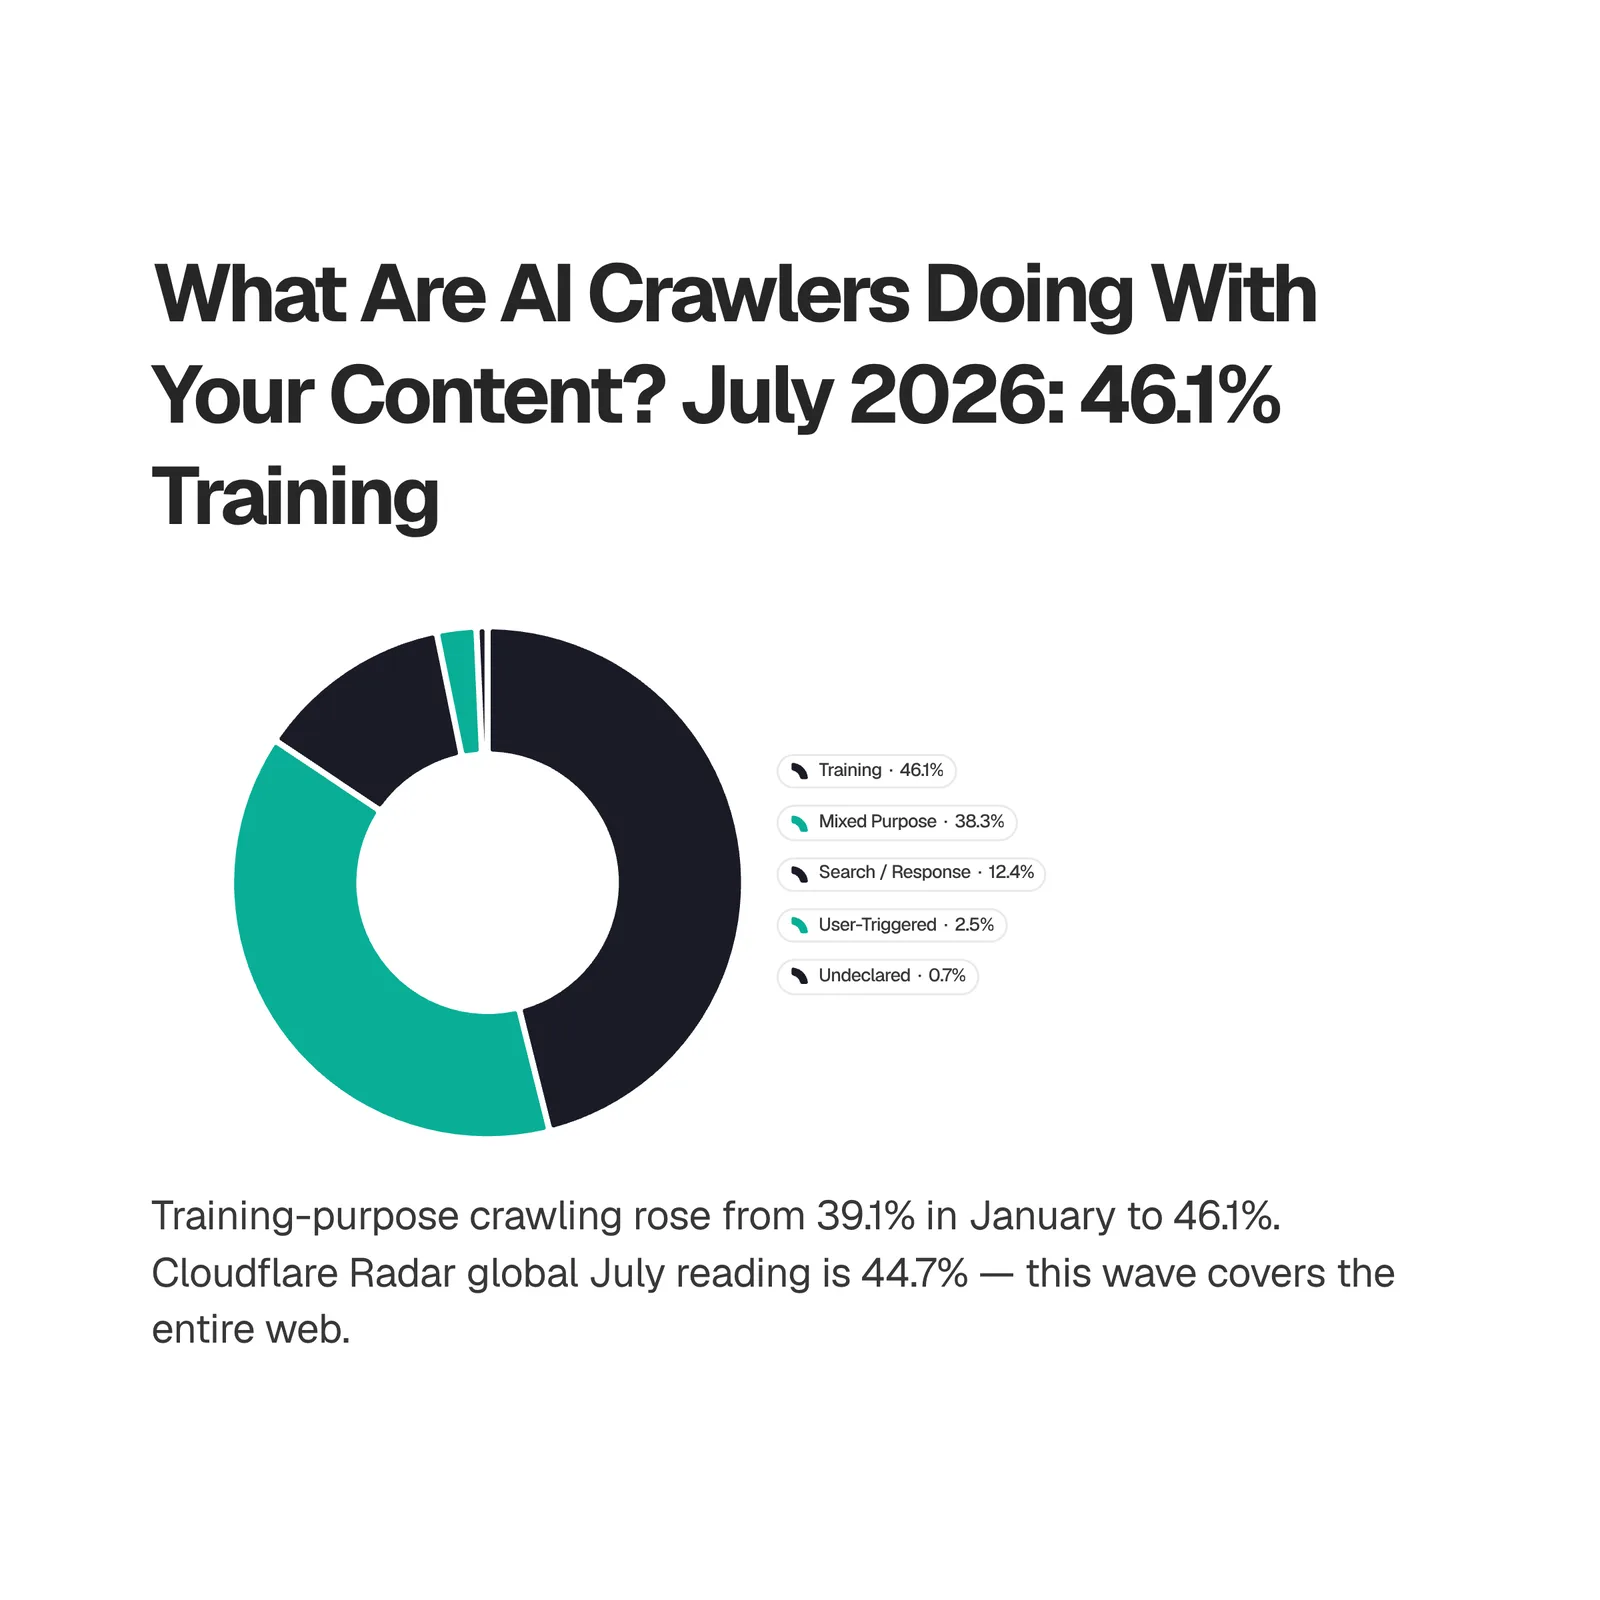
Read the panel and global columns side by side and the gap nearly vanishes. In July the business web sat 1.4 points above the global web on training, 0.8 points above on search, and level on user-action fetches. I expected our B2B-heavy panel to run much hotter on training, because documentation, engineering blogs, and changelogs are exactly what model builders want: clean, factual, well-structured prose with stable URLs. It runs a little hotter. The training wave is a web-wide phenomenon, and a SaaS docs page is riding it, not causing it.
💡Quick Insight: Same month, two datasets: training-purpose crawling was 46.1% of AI-bot hits on our panel in July 2026 (Jul 1-21) and 44.7% globally on Cloudflare Radar. The business web isn't a special case. The training wave is everywhere.
August is where the global picture moves. Training fell to 40.0% of AI-bot requests worldwide, search-purpose crawling jumped to 17.2%, and user-action fetches doubled to 5.2%. One caveat before anyone calls that a trend: Radar's "other" user-agent bucket also jumped in August (6.6% to 14.2%), which smells like newly classified agents. If August holds through September, AI crawling is tilting from ingestion toward retrieval, and retrieval is the kind of crawl that turns into a citation, the thing our answer engine insights exist to count.
What the bots fetch is less exotic than you'd expect. In July, 72.5% of AI-bot requests worldwide were for HTML, with JSON (6.9%), plain text (5.9%), JavaScript (5.4%), and images (5.3%) splitting most of the rest. Plain text rose to 8.3% in August.
The direction matches what Cloudflare measures across its whole network: Cloudflare's June 2026 report found 52% of crawler requests are now for AI training, up from 22% in Spring 2025. The run-up started earlier. HUMAN Security's 2026 benchmarks measured AI training crawler volume growing 136% across calendar 2025, with the steepest climb from August to October of that year.
If you publish docs, blog, or changelog content, assume close to half of your AI-bot hits are training crawls. That raises the stakes of the allow-or-block decision below.
Which industries do AI crawlers hit hardest?
Three verticals absorb about two-thirds of all crawler traffic, on the sites we track and on the global web alike. The order differs, and the difference is our panel's B2B mix talking.
| Vertical | Panel, Jul* | Radar, Jul† |
|---|
| Computer & electronics | 24.0% | 19.1% |
| Internet & telecom | 21.6% | 20.6% |
| Shopping | 21.2% | 25.7% |
| News & media | 7.9% | 9.0% |
| Gambling | 4.0% | 6.7% |
| Finance | 2.7% | 2.6% |
| Games | 1.3% | 2.3% |
* Share of crawler hits on our panel, July 2026 (Jul 1-21). † Cloudflare Radar, share of global crawler traffic by site vertical, July 2026.
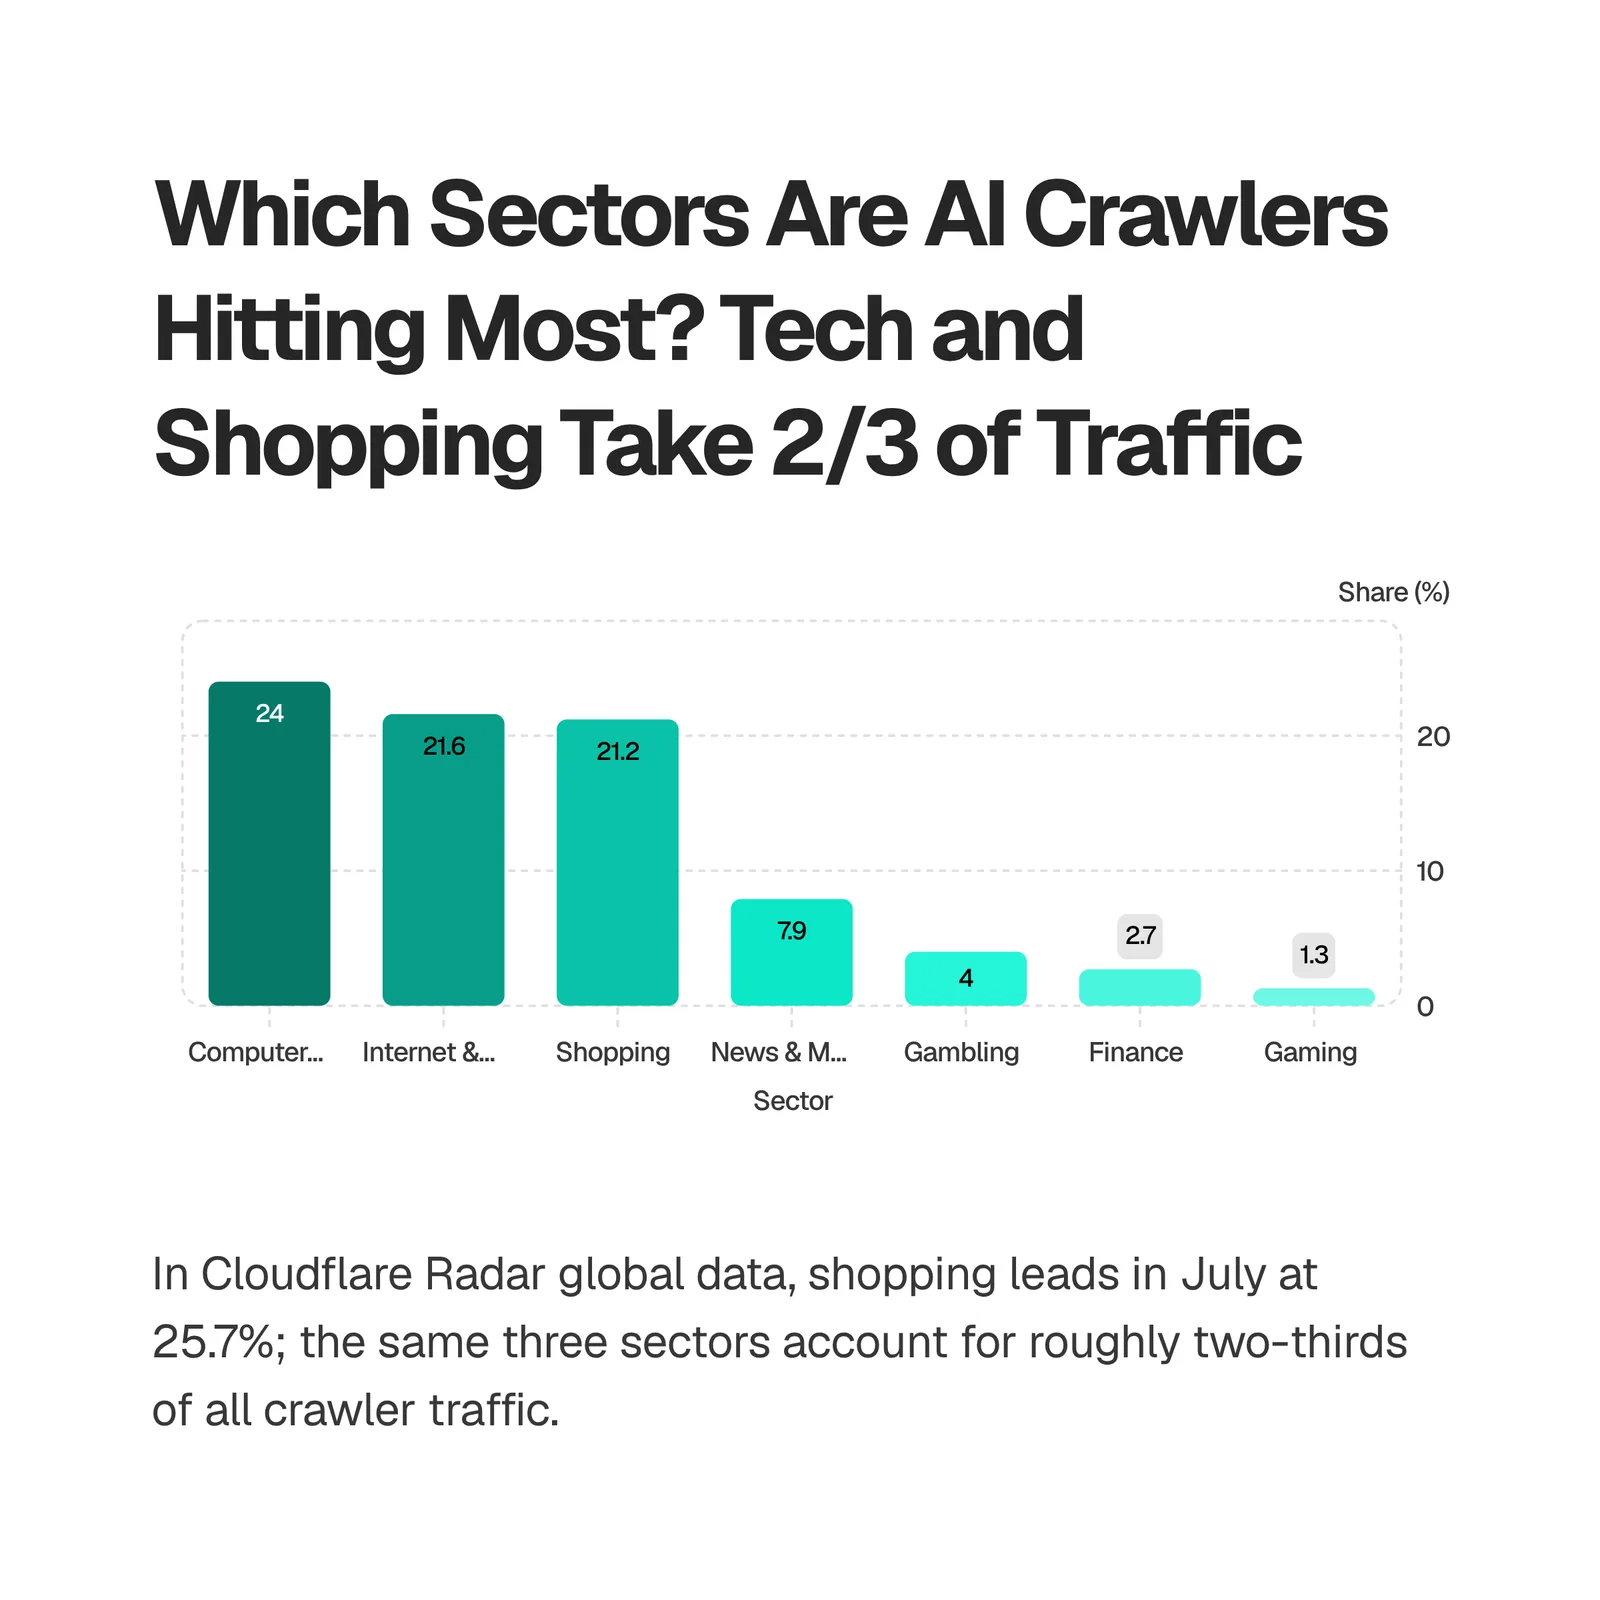
Shopping leads globally at 25.7% of crawler traffic in July 2026. On our panel, computer and electronics leads at 24.0%, with shopping third at 21.2%; software-heavy customers explain the swap. The number I'd flag for anyone running a store is the per-site load: shopping sites are about 20% of the sites we track but pull 21.2% of the crawler hits, so a shop carries more crawler traffic per site than a software company does. Gambling draws 6.7% of global crawler traffic against 4.0% on our panel; finance is level at just under 3% in both.
📌Pro Tip: If you run an e-commerce site, crawler management isn't optional. Shopping is the most-crawled vertical on the global web (25.7% of crawler traffic on Cloudflare Radar, July 2026) and pulls more hits per site than any other segment on our panel.
How often do AI crawlers get blocked?
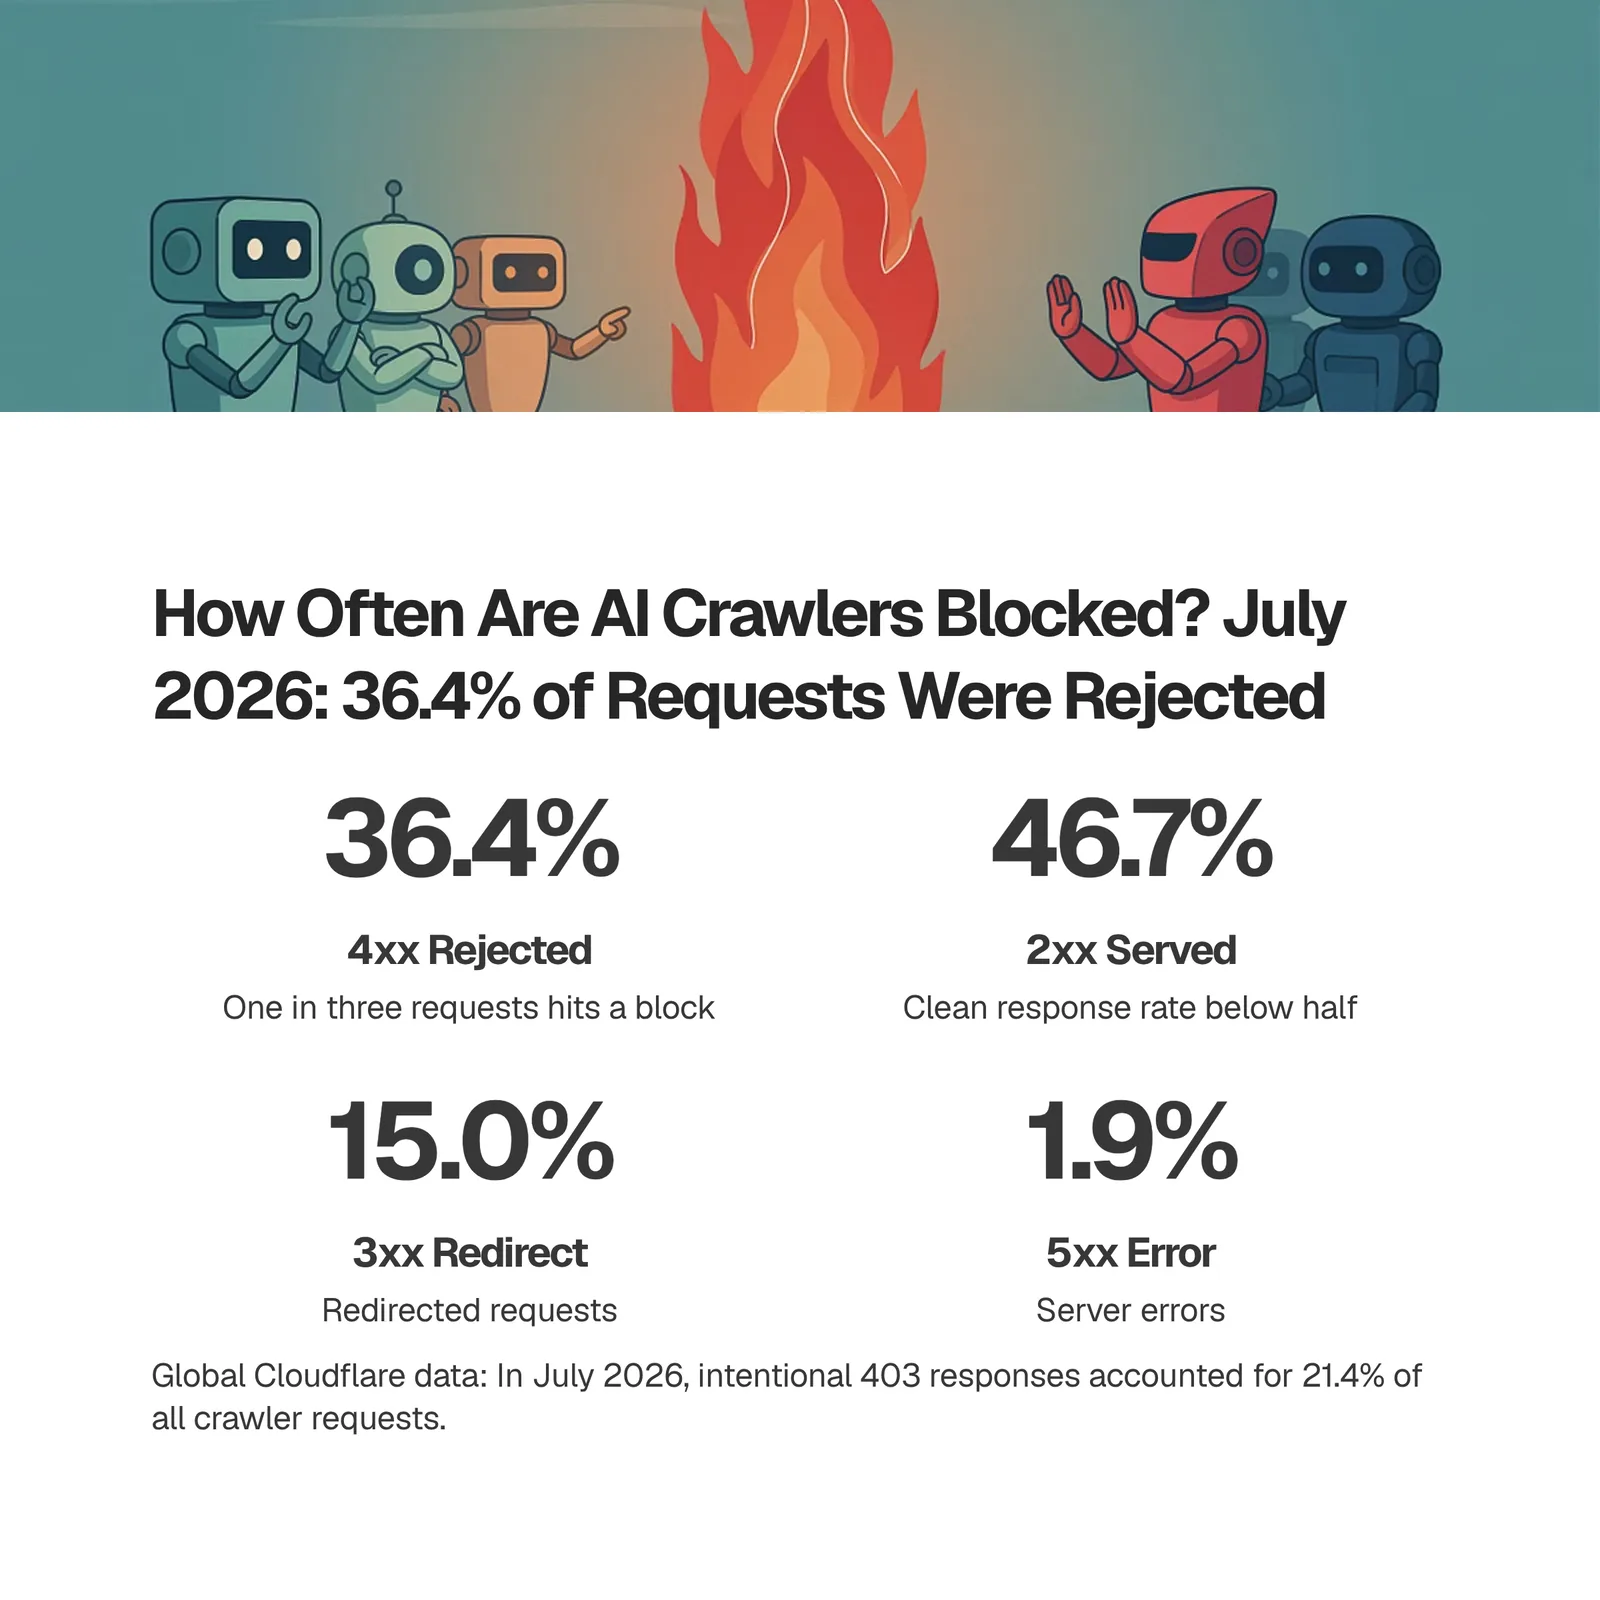
More than one in three crawler requests now dies at the door. In July 2026 (Jul 1-21), 36.4% of crawler requests across the sites we monitor were rejected with a 4xx status, and the share answered with a clean 2xx fell to 46.7%. January's 4xx rate was 34.8%; June's was 37.2%. The wall has been rising all year, and Cloudflare Radar's global response codes show the same masonry going up:
| Status (global) | Jan | Jul | Aug† |
|---|
| 200 served | 49.3% | 45.7% | 44.0% |
| 403 forbidden | 20.1% | 21.4% | 24.0% |
| 404 not found | 7.5% | 8.1% | 8.5% |
| 429 rate-limited | 4.4% | 5.2% | 4.3% |
| 301/302 redirect | 11.5% | 12.9% | 13.0% |
† Cloudflare Radar, share of global crawler requests by response status, calendar months of 2026; August covers Aug 1-28. Rows shown are the largest buckets; 204, 304, 503, and other codes make up the remainder.
The wall is mostly 403s. Deliberate refusals were 21.4% of all crawler requests worldwide in July, nearly three times the 404s (8.1%), so the rejections are policy, not broken links. Add 403, 404, and 429 together and the global 4xx rate reads 34.7% in July against our panel's 36.4%. Our panel runs about two points above the global web on rejections, which is what I'd expect from SaaS teams that manage bot access on purpose. Rate limiting had its own moment: 429s spiked to 7.2% of global crawler requests in June before settling back to 5.2% in July.
🔑Key Takeaway: More than 1 in 3 crawler requests (36.4% in July 2026, Jul 1-21) is rejected with a 4xx on the sites we monitor. The share served a 2xx has fallen below 50%, and globally 403s alone are now 24% of crawler requests.
Our crawl waste report breaks that wall down bot by bot (who eats the most rejections, and what it does to crawl budget), so I won't re-litigate it here.
robots.txt is the intent layer above those status codes, and it tells the same story from the other side. Across 4,257 top-domain robots.txt files our audit crawler parsed on July 20, 2026, the four most-named agents are all AI crawlers. Cloudflare Radar's independent global scan (August 24, 2026) ranks the same four in the same order:
| Agent | Our crawl (Jul 20) | Radar (Aug 24) |
|---|
| GPTBot | 773 | 827 |
| ClaudeBot | 629 | 726 |
| Google-Extended | 578 | 690 |
| CCBot | 568 | 654 |
Counts are robots.txt files naming the agent. Ours: 4,257 top-domain files parsed July 20, 2026. Radar: global top-domain scan, August 24, 2026.
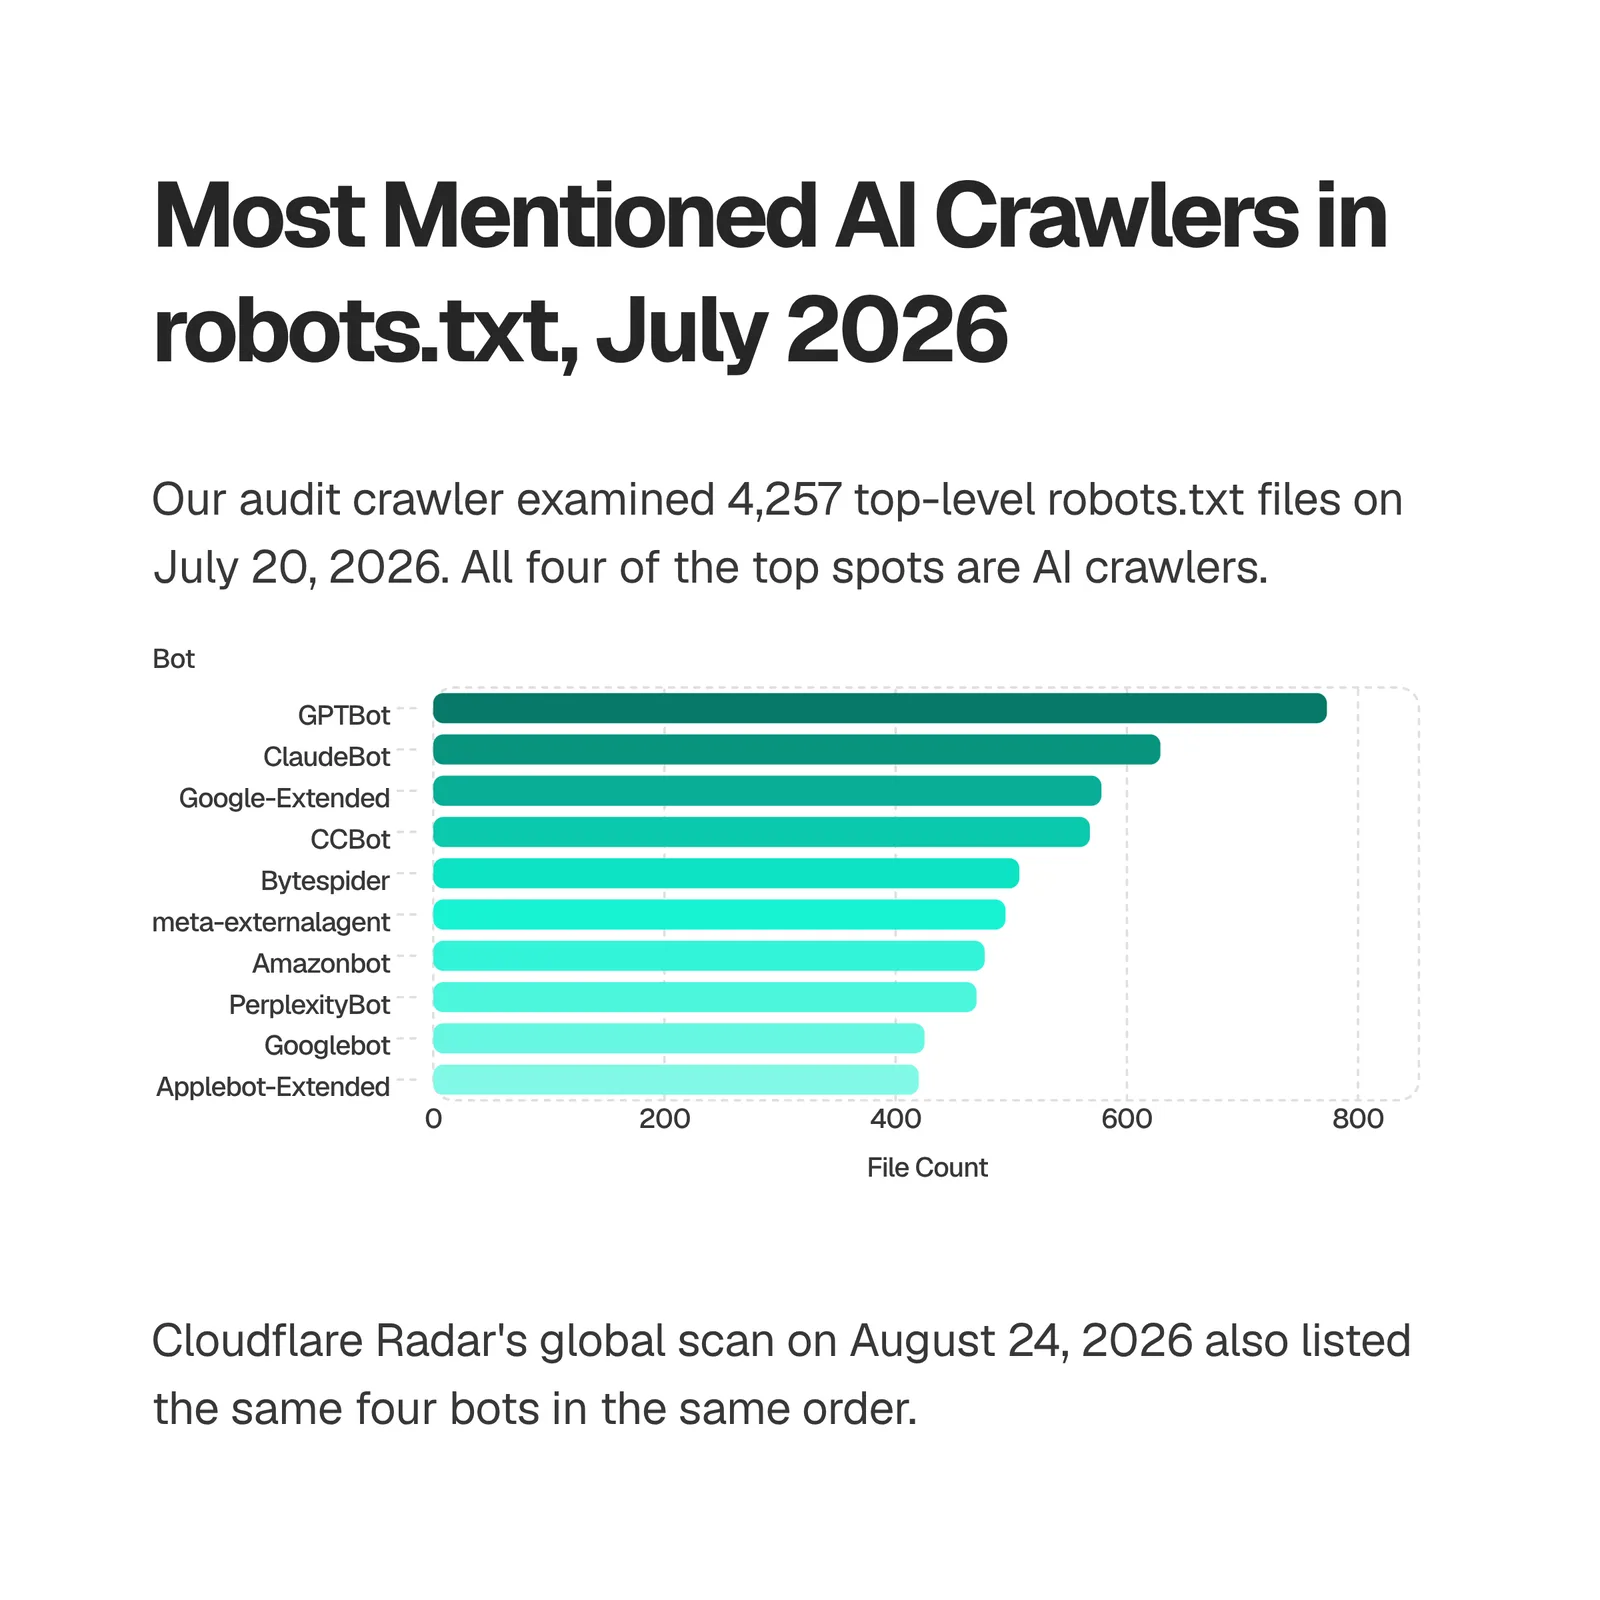
Two independent scans, one conclusion: AI opt-out is now the #1 reason robots.txt files get written. On Radar's August scan, Googlebot, the agent these files spent two decades addressing, appears in fewer files (427) than ten different AI-era agents, Bytespider, PerplexityBot, and ChatGPT-User included.
How much traffic do AI crawlers send back?
A crawl-to-refer ratio is the number of pages a bot operator fetches for every referral visit its product sends back. It's the fairest single measure of whether a crawler is a trade or an extraction, and July 2026 is the first month our panel and the global web agree on it almost line for line.
| Operator | Panel, Jul* | Radar, Jul† | Radar, Aug† |
|---|
| Mistral | 6,021:1 | 29,944:1 | no referrals |
| Anthropic | 2,363:1 | 1,915:1 | 899:1 |
| Perplexity | 263:1 | 296:1 | 891:1 |
| OpenAI | 179:1 | 256:1 | 391:1 |
| Microsoft | 35:1 | 37:1 | 36:1 |
| Google | 4:1 | 5:1 | 5:1 |
| DuckDuckGo | 3:1 | 2:1 | 2:1 |
* Pages crawled per referral session on our panel, July 2026 (Jul 1-21). † Cloudflare Radar, global crawl-to-refer ratio by operator, calendar months; August covers Aug 1-28. Radar reports Mistral's August ratio as undefined: crawling with no measurable referrals.
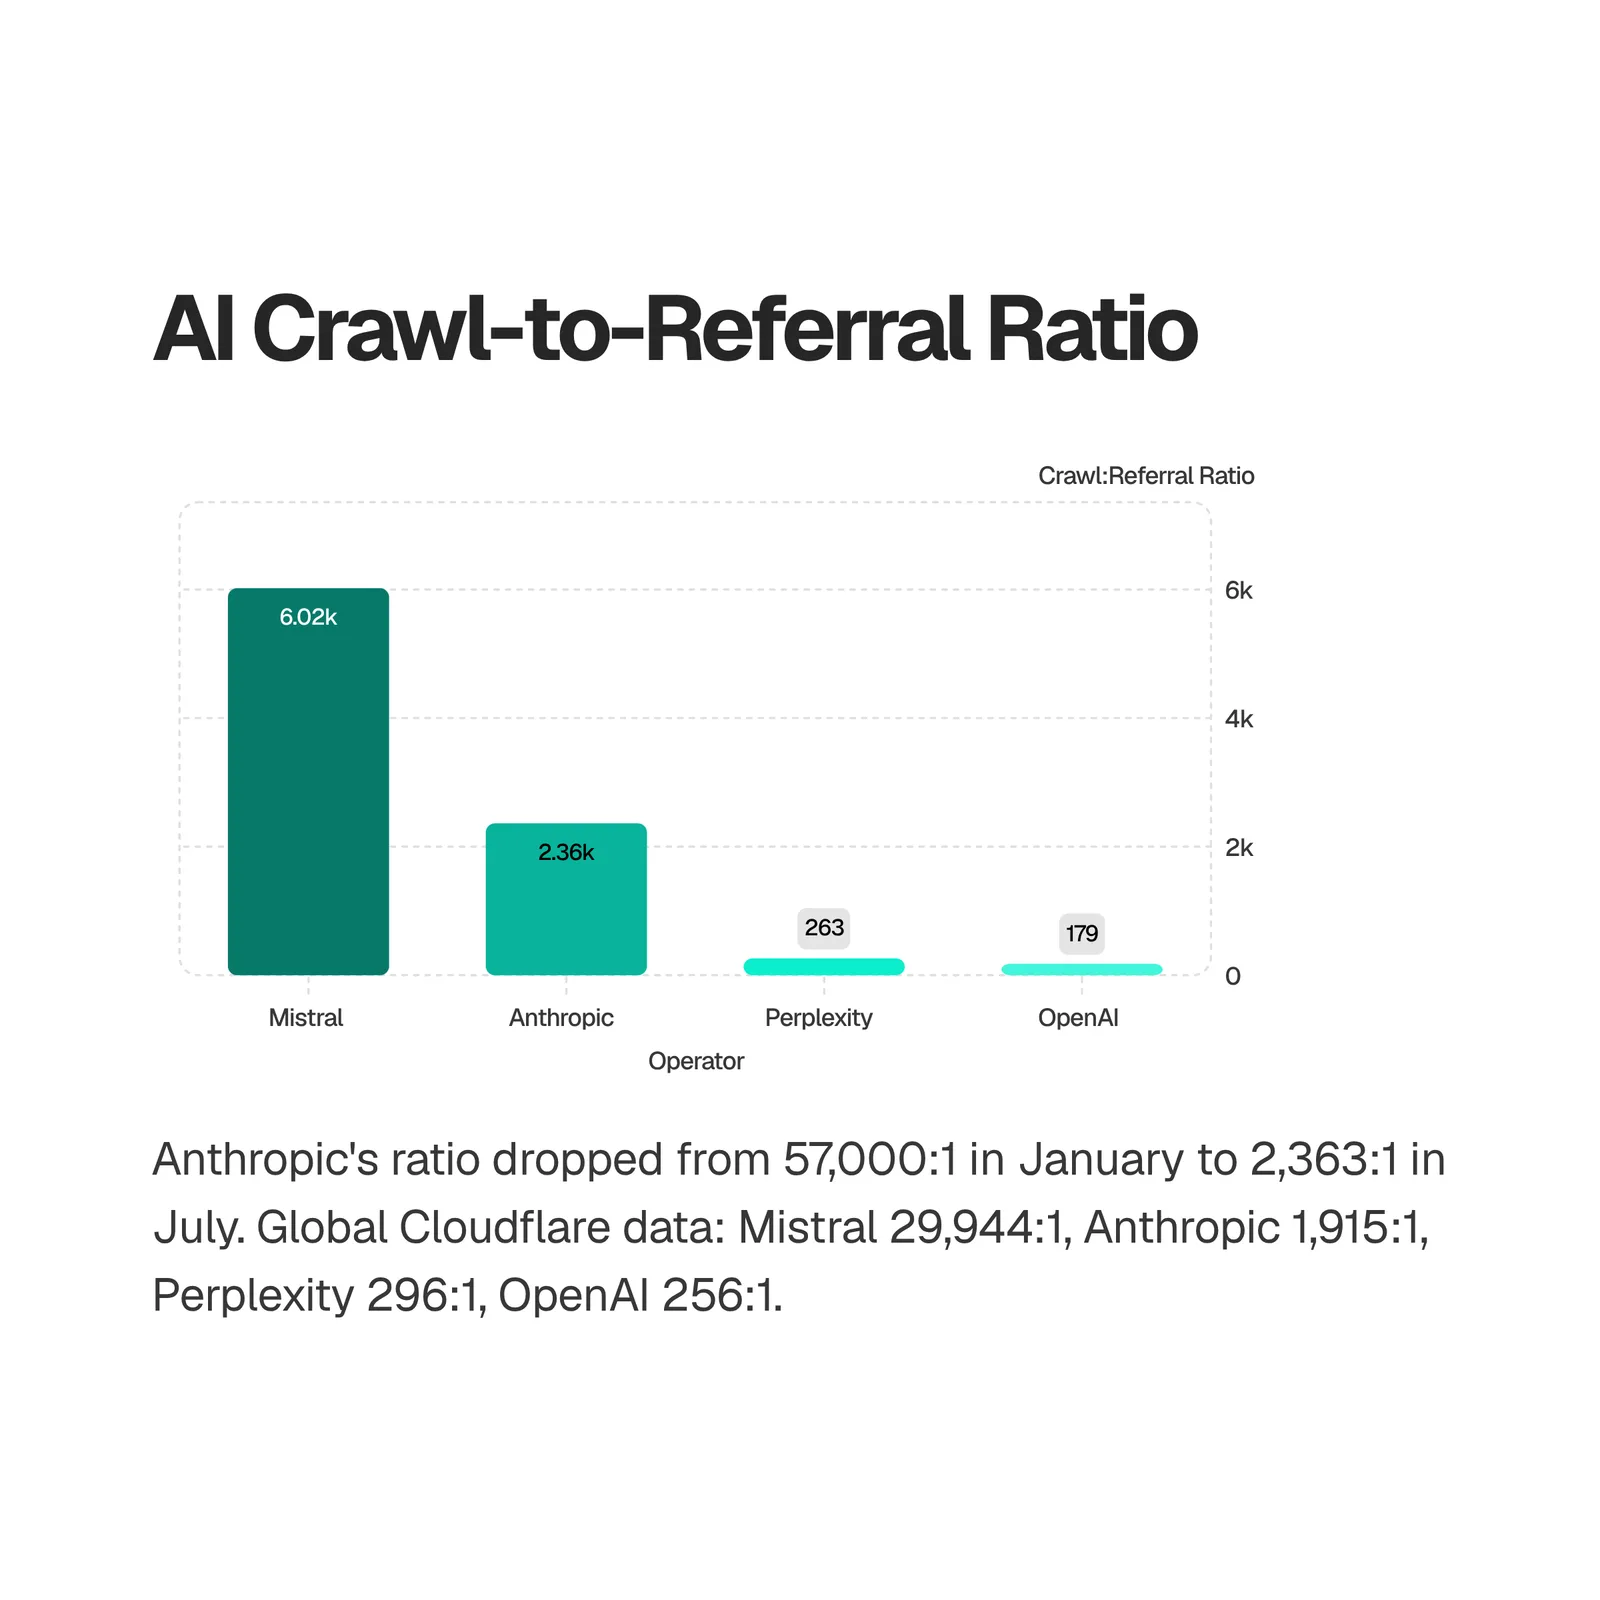
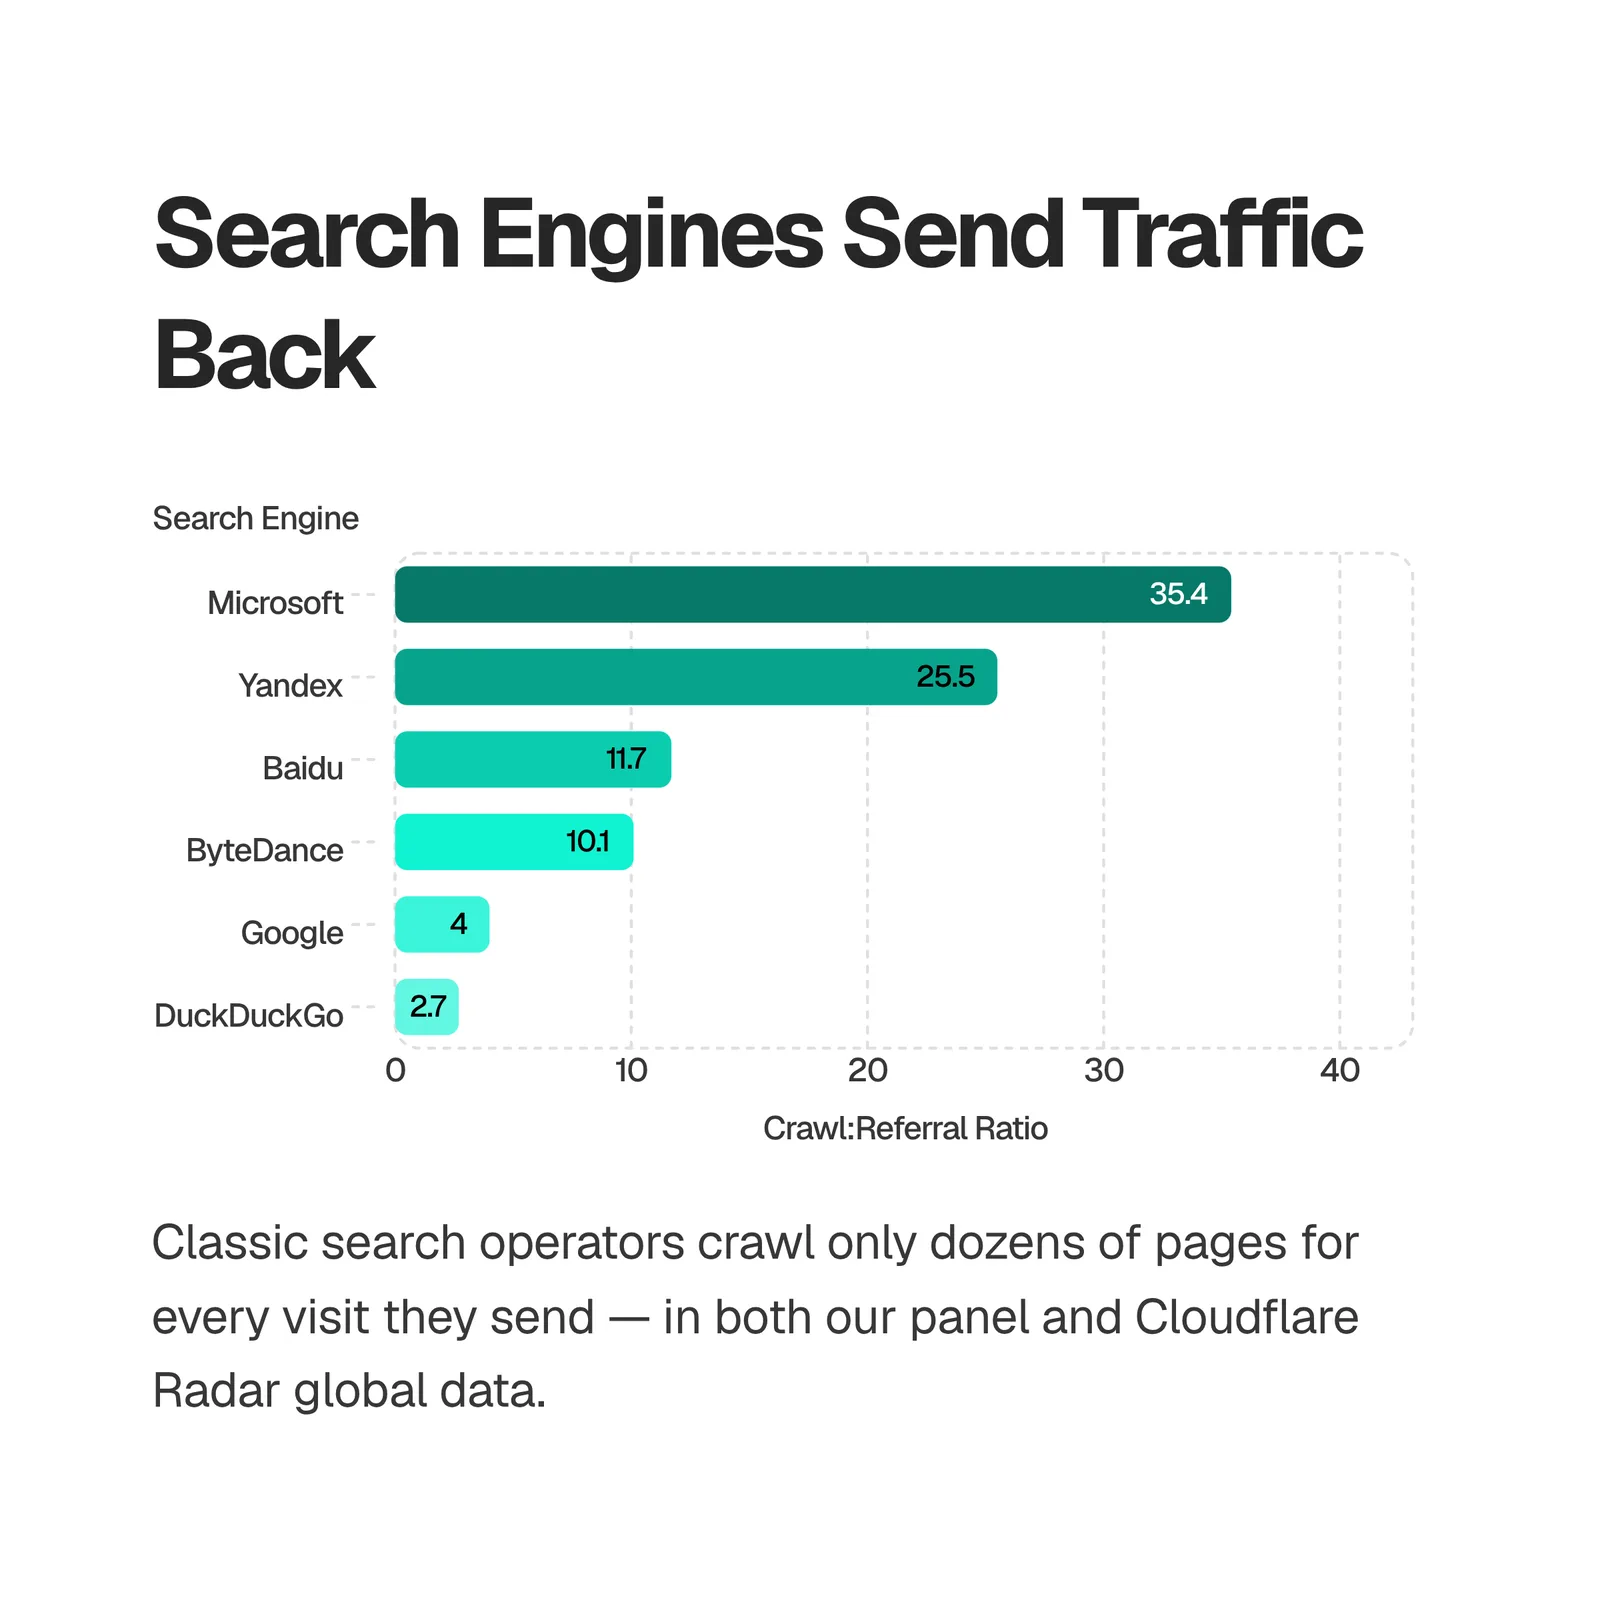
Anthropic is the turnaround. Its ratio on the sites we track collapsed from roughly 57,000:1 in January 2026 to about 2,400:1 by July, and Radar's global series kept going: 1,915:1 in July, 899:1 in August. It now sends real referral traffic back. OpenAI moved the other way in August (256:1 to 391:1), and Perplexity tripled (296:1 to 891:1), so the two operators most people think of as "search" got more extractive over the summer. Mistral is the outlier in both datasets: 6,021:1 on our panel in July, 29,944:1 globally, and in August Radar could find no referrals at all against its crawling. The classic search engines sit at 2:1 to 5:1 by design, and they do so identically on our panel and worldwide, which is the best evidence I have that the two datasets are measuring the same thing. The full extraction-gap analysis, month by month, lives in our crawl-to-refer deep dive.
Should you allow or block AI crawlers?
Allow the bots that cite you and fetch for users; treat training-only bots as a business decision. That's the whole framework. The July data just sharpens each side of it.
| Bot class | Examples | Call |
|---|
| Search / citation | OAI-SearchBot, PerplexityBot | Allow |
| User action | ChatGPT-User, Claude-User | Allow |
| Training only | GPTBot, CCBot, Bytespider | Case-by-case |
I'd love to hand you a cleaner answer than "case-by-case," but a blanket rule is exactly how sites end up blocking the bots that send them readers.
- Blocking search and user-action bots (Claude-SearchBot included) removes your pages from the answers those engines write: you lose citations and referrals and gain nothing, which defeats the whole point of answer engine optimization. The referral economics are thin but real. 2025 Stanford Graduate School of Business research, summarized in Arc XP's analysis, put click-through rates from AI chatbots at 0.33% and AI search engines at 0.74%, against 8.6% for Google Search. Thin, but a citation carries brand value a click-through rate doesn't capture.
- Training-only bots are the real negotiation. GPTBot's training use, CCBot, and Bytespider take corpus value and send nothing back on any timescale you can measure. With training near half of AI-bot hits on our panel in July 2026, a blanket "allow all" gives away more than it did a year ago.
- The answer isn't permanent. Anthropic's referral turnaround (the crawl-to-refer collapse above) shows a bot worth blocking in January can be worth allowing by July. Revisit the call monthly, per operator.
🚩Red Flag: Blocking Claude-SearchBot, OAI-SearchBot, or ChatGPT-User removes your pages from the answers those engines write. You lose citations and referrals while the training debate carries on without you.
AI crawler directory: who runs what
The decision only works if you can tell the bots apart, and the naming doesn't help: three Anthropic agents, three OpenAI agents, three Google agents, each with a different job. Roles below come from Cloudflare Radar's bot directory as of August 28, 2026, translated into plain words (Radar's AI_CRAWLER is a training crawler; AI_SEARCH and SEARCH_ENGINE_CRAWLER are search crawlers; AI_ASSISTANT is a user-action fetcher).
| Agent | Operator | Role |
|---|
| GPTBot | OpenAI | Training crawler |
| OAI-SearchBot | OpenAI | Search crawler |
| ChatGPT-User | OpenAI | User-action fetcher |
| ClaudeBot | Anthropic | Training crawler |
| Claude-SearchBot | Anthropic | Search crawler |
| Claude-User | Anthropic | User-action fetcher |
| Meta-ExternalAgent | Meta | Training crawler |
| Amazonbot | Amazon | Training crawler |
| Applebot | Apple | Search crawler |
| GoogleOther | Google | Training crawler |
| Google-CloudVertexBot | Google | Training crawler |
| MistralAI-User | Mistral AI | User-action fetcher |
Source: Cloudflare Radar bot directory (radar/bots/{slug}), August 28, 2026. We left out the directory's robots.txt-compliance flag on purpose: it didn't match every operator's published documentation when we cross-checked, so read each operator's own crawler page before you rely on a rule being honored.
If you differentiate, do it precisely. Our robots.txt guide covers per-agent directives, CDN-level tools like Cloudflare's AI Crawl Control expose the same allow/block levers per bot, and our llms.txt guide covers the proposed companion file (adoption is real; measured impact isn't yet).
How to run this report on your own site

Every number in this AI crawler report comes from a repeatable pipeline: logs in, user agents verified and mapped, purposes classified, blocks and referrals counted. You can run the same report on one site with an afternoon of work. No global dashboard will tell you what's crawling your pages.
- Pull 30 days of raw access logs from your origin or CDN. You need four fields per request: user agent, IP, path, and status code.
- Verify before you count. Check claimed Googlebot, GPTBot, or ClaudeBot hits against reverse DNS or the operator's published IP ranges. In my experience this is the step people skip, and spoofed agents are common enough that skipping it quietly invalidates the rest of the report.
- Map user agents to operators, keeping roles separate. ClaudeBot, Claude-SearchBot, and Claude-User all belong to Anthropic but do different jobs; your report should never merge them. The directory above is the starting map.
- Classify each bot's purpose (training, search, user action) from the operator's own documentation, then compute your purpose mix and compare it against the panel and Radar figures above.
- Compute your block rate and referral ratio. Share of verified bot requests answered 4xx per agent, checked against what your robots.txt says you intend. Drift between the two is where crawl budget dies. Then segment sessions referred from chatgpt.com, perplexity.ai, and friends to get your own crawl-to-refer ratio.
- Repeat monthly and read deltas, not levels. One month is trivia. The ClaudeBot spike-and-cool above only means something because May, June, and July sit side by side.
📌Pro Tip: Never trust a user-agent string on its own. Verify claimed bot hits with a reverse-DNS lookup or the operator's published IP ranges before they enter your report. Spoofed agents will otherwise inflate every number in it.
This is also the pipeline SEOmator Agent Analytics automates. It's the instrument behind every panel number in this post: it classifies AI-bot hits, purposes, block rates, and referrals across 500+ sites and 50M+ tracked users a month. If you'd rather start smaller, a free SEO audit flags robots.txt and crawlability problems in about a minute, and our GEO audit tool checks how your pages read to the answer engines these crawlers feed.
Methodology and sources
Panel data. All "panel" and "sites we track" figures come from SEOmator Agent Analytics: 500+ sites and 50M+ users tracked monthly, January-July 2026. The panel skews toward the business web (roughly 60% B2B SaaS, 20% e-commerce, 20% mixed), so panel shares describe that population, never the web at large. July 2026 panel figures are partial, covering July 1-21; treat July deltas as directional until the August edition closes the month. robots.txt figures come from our audit crawler: 4,257 top-domain robots.txt files parsed on July 20, 2026.
Global data. Source: Cloudflare Radar — radar/bots/summary/bot_operator, radar/ai/bots/summary/user_agent, radar/ai/bots/summary/crawl_purpose, radar/ai/bots/summary/content_type, radar/bots/crawlers/summary/response_status, radar/bots/crawlers/summary/vertical, radar/bots/crawlers/summary/crawl_refer_ratio, radar/robots_txt/top/user_agents/directive, radar/bots/{slug} (radar.cloudflare.com), pulled August 28, 2026. Global figures are calendar months of 2026 (January, May, June, July), plus August 1-28 where an August column appears; Radar's robots.txt scan is dated August 24, 2026. Radar shares are percentage-normalized; we cite rankings and shares, not absolute request volumes. Two taxonomy notes: Anthropic appears as a distinct operator in both datasets from June 2026, when Radar's bot classification expanded (our panel follows the same taxonomy), and Radar's "other" user-agent bucket jumps in August, so August global shares are provisional.
Cadence. This report refreshes monthly on this URL. Prior editions are archived on-page as each new month is published, so month-over-month claims stay checkable.
FAQ
What is an AI crawler report?
An AI crawler report tracks how AI bots access a site or the wider web: traffic share by crawler and operator, crawl purpose mix (training, search, user action), block rates, robots.txt directives, and crawl-to-refer ratios. Monthly editions matter because shares move fast: ClaudeBot doubled its share of the AI-bot mix on our panel in a single month in 2026.
What changed in AI crawler activity in July 2026?
Three things stood out across the sites we track. ClaudeBot cooled from 22.4% to 19.2% of the AI-bot mix (July 1-21), Meta-ExternalAgent rebounded from 10.7% to 12.7%, and training-purpose crawling held near its June peak at 46.1%. Cloudflare Radar's global July shows the same two moves (ClaudeBot 19.8% to 16.5%, Meta-ExternalAgent 10.2% to 12.5%). Rejection rates stayed high, with more than a third of crawler requests answered 4xx.
Is ChatGPT a web crawler?
No. ChatGPT is an application; the crawling happens under separate OpenAI user agents. GPTBot collects training data, OAI-SearchBot powers search and citations, and ChatGPT-User fetches a page live when a user asks about it. Each can be addressed separately in robots.txt, so you can stay citable in ChatGPT while opting out of model training.
What are the main AI crawler bots in 2026?
On our panel in July 2026 (July 1-21), the biggest AI-bot user agents were Googlebot, ClaudeBot, Meta-ExternalAgent, GPTBot, and the newly arrived Claude-SearchBot. Globally, Cloudflare Radar's July ranking runs Googlebot, ClaudeBot, Meta-ExternalAgent, GPTBot, Bingbot, then Applebot and Amazonbot, with Bytespider and Claude-SearchBot further down. The ordering shifts month to month.
Which AI crawlers should I block, and which should I allow?
Allow search and user-action bots (OAI-SearchBot, Claude-SearchBot, ChatGPT-User, Claude-User, PerplexityBot): they produce citations and referrals. Decide separately on training-only crawlers (GPTBot's training use, CCBot, Bytespider), which take corpus value without sending traffic back. Blanket blocks remove you from AI answers entirely; blanket allows give away training value silently.
How do I stop AI crawlers I don't want?
Name each agent in robots.txt with a Disallow rule; the major AI crawlers honor it. robots.txt is a request, not a wall, so pair it with server or CDN enforcement (4xx responses, bot management rules, tools like Cloudflare's AI Crawl Control) for agents that ignore directives. The rising 403 rates on Cloudflare Radar (24% of global crawler requests in August 2026) show many sites already enforce this way.
How do I track AI crawler bots on my site?
Parse server or CDN logs for known AI user agents, verify them against reverse DNS or published IP ranges, then group by operator and purpose. Watch four numbers monthly: share per bot, purpose mix, 4xx block rate, and AI referrals. An analytics layer that classifies AI bots automatically, like the Agent Analytics panel behind this report, replaces the manual pipeline.
Does blocking AI crawlers hurt AI Overviews visibility?
Google's AI Overviews draw on standard Googlebot indexing, so blocking Google-Extended (the Gemini training opt-out) doesn't remove you from AI Overviews; blocking Googlebot itself would. The bigger risk is legacy blanket rules written against training crawlers that also catch citation bots like OAI-SearchBot or Claude-SearchBot, silently removing you from other engines' answers.
In opposite directions, on our panel and worldwide. ClaudeBot eased off its June spike in July (22.4% to 19.2% across the sites we track; 19.8% to 16.5% globally) while Meta-ExternalAgent climbed. By August, Cloudflare Radar had ClaudeBot down to 11.7% and Meta-ExternalAgent up to 13.9%, so Meta retook the #2 spot behind Googlebot worldwide. Watch the August edition to see whether our panel follows.
What does a Cloudflare AI crawler report show?
Cloudflare Radar's AI insights show global, percentage-normalized shares: bot traffic by operator, AI-bot traffic by user agent, crawl-purpose mix, content types fetched, response codes, crawler traffic by industry vertical, crawl-to-refer ratios, and which agents robots.txt files name most often. It describes the internet at large. Pair it with your own log data or a panel view: a global average can't tell you what's crawling your site, or why.