


· 14 min read
Core Web Vitals Assessment Failed? Fix LCP, INP & CLS
Slow mobile LCP is the single most-failed rule across the 100,000+ sites we audited in 2026. Find which metric failed, fix it, and pass the assessment.
Largest Contentful Paint (LCP), explained with fresh data: of 115 Google page-1 results we tested in October 2026, only 8.7% hit 2.5 s. Here's what to fix.

Largest Contentful Paint (LCP) measures how long it takes for the largest visible content element, typically a hero image or a block of text, to render on screen. Google's bar is 2.5 seconds or less for 75% of real visits. When we tested 115 Google page-1 results in October 2026, only 8.7% met it in the lab.
This guide explains what LCP means and how it differs from other performance metrics, then shows what the pages that actually rank look like when you measure them. The numbers come from a mobile Lighthouse run we did ourselves on 1 October 2026, and they change which fixes deserve your time first.
Largest Contentful Paint is a user-centric performance metric that captures the moment when your page's most significant content becomes visible. The name breaks down simply:
The LCP element can be:
<img> tags, CSS background images, or images within <svg>)LCP only considers content within the initial viewport. If your largest element sits below the fold, it won't factor into the LCP calculation—only what users see immediately matters.

First Contentful Paint (FCP) and Largest Contentful Paint (LCP) measure different moments in the page loading process:
First Contentful Paint (FCP) captures when any content first appears—the moment users get visual feedback that something is loading. This could be a loading spinner, navigation bar, or placeholder text.
Largest Contentful Paint (LCP) marks when the main content becomes visible—the point users perceive the page as "loaded" and ready to use.
Think of them as two milestones in the user's journey:
While FCP focuses on initial feedback, LCP measures when users can actually engage with your content. In Lighthouse's Performance score, LCP also weighs far more: 25% against FCP's 10% (Chrome for Developers).
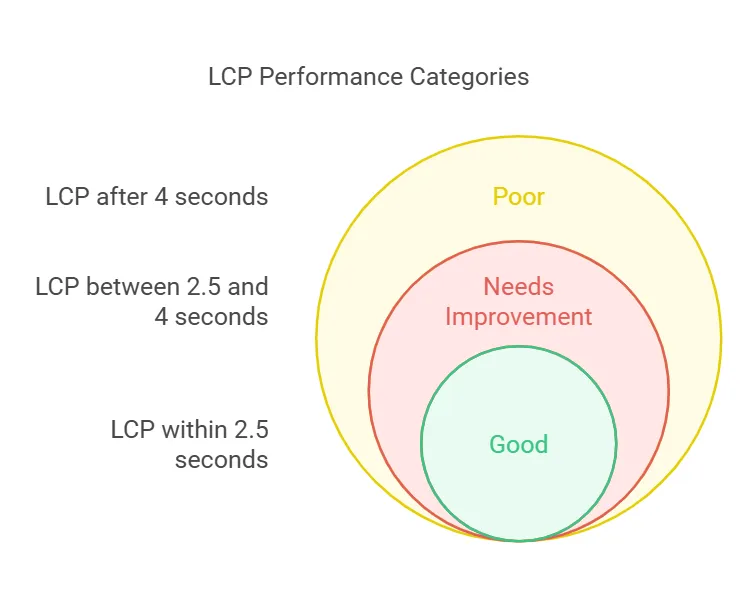
Google defines three LCP performance categories:
Google recommends that 75% of your page loads achieve the "Good" threshold. In web.dev's words, "a good threshold to measure is the 75th percentile of page loads, segmented across mobile and desktop devices" (web.dev). This accounts for variation in user devices and network conditions while ensuring most visitors have a positive experience.
Most of the web is close but not there. According to the HTTP Archive Web Almanac 2025, 62% of mobile pages and 74% of desktop pages achieve a good LCP, based on real Chrome users in July 2025.
Slower than most LCP guides suggest. On 1 October 2026 we ran mobile Lighthouse 13.5 on 115 Google page-1 results for 15 commercial US keywords, from payroll software to robot vacuums, using the same settings as our free website speed test. The median lab LCP was 10.0 seconds, and only 8.7% of the pages painted their main content within 2.5 seconds.
Two caveats belong next to those numbers. They are lab runs from one machine under Lighthouse's simulated slow mobile profile, so absolute times run higher than a fast connection sees. We checked the setup against Google: our own homepage scored a 7.8-second LCP in our run and 8.1 seconds in PageSpeed Insights the same morning. And position was unrelated to speed in this sample (Spearman's ρ = 0.04, not significant). Ranking pages are not fast pages; they are relevant pages that are often slow.
What the run did show clearly is what the LCP element is on pages that rank:
| LCP element on 115 page-1 results | Share |
|---|---|
| Text (a heading or paragraph) | 47.0% |
| Image | 42.6% |
| Video | 0.9% |
| Not identified by Lighthouse | 9.6% |
That matters because the fix depends on the element. A text LCP is usually waiting on fonts, CSS or JavaScript. An image LCP is usually waiting on the image request itself.
LCP became part of Google's ranking systems with the page experience update that began rolling out in June 2021. Google is clear on both halves of the story: "Core Web Vitals are used by our ranking systems", and "Google Search always seeks to show the most relevant content, even if the page experience is sub-par" (Google Search Central).
From an SEO perspective, LCP affects rankings in two ways:
Direct ranking signal: Google includes Core Web Vitals in its page experience systems. While content relevance still dominates, LCP can be the tiebreaker between similar pages, which fits our own data: across 115 page-1 results, speed did not predict position.
The visitor: A slow main paint loses people before they read anything, and that is where the money is. Vodafone A/B-tested a landing page whose field LCP was 31% better and saw 8% more sales (web.dev case study).
Google splits every LCP into four sub-parts, and each one points at a different fix (web.dev):
| Sub-part | What it is | web.dev target share |
|---|---|---|
| Time to First Byte | Until the first byte of HTML arrives | ~40% |
| Resource load delay | From that byte until the LCP resource starts loading | under 10% |
| Resource load duration | Downloading the LCP resource itself | ~40% |
| Element render delay | From the resource being ready until the element paints | under 10% |
Four main factors feed those sub-parts:
Time to First Byte (TTFB) measures how long the server takes to respond to a browser request. Every millisecond of server delay directly adds to your LCP. Common causes include slow database queries, unoptimized server-side code, and poor hosting infrastructure.
JavaScript and CSS files that block rendering prevent content from appearing until they're fully downloaded and processed. The browser can't paint anything until it processes these critical resources. On a text LCP this is usually the biggest delay: across the text-LCP pages in our sample, element render delay was the median 42.9% of the measured time.
Large images, videos, and web fonts take time to download. An unoptimized hero image on a mobile connection can add seconds to your LCP.
Single-page applications built with React, Vue, or Angular often require JavaScript execution before displaying content. The browser must download, parse, and execute scripts before rendering—adding significant delay compared to server-rendered HTML.
Before optimizing, you need accurate measurements. Three tools cover it:
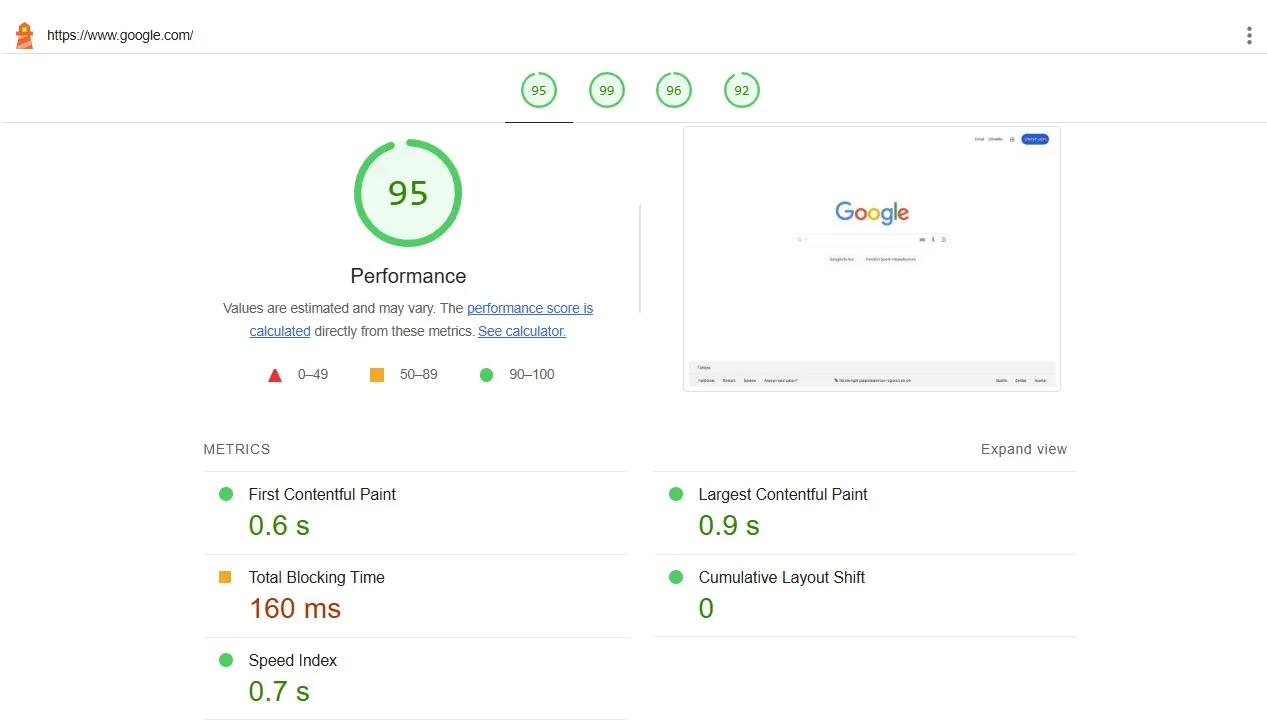
SEOmator's free speed test runs a Google Lighthouse audit on any public URL. Enter your URL, select device type, and get the full report, including your LCP time and the element that produced it. It is lab data: one simulated load, not what your visitors experienced.
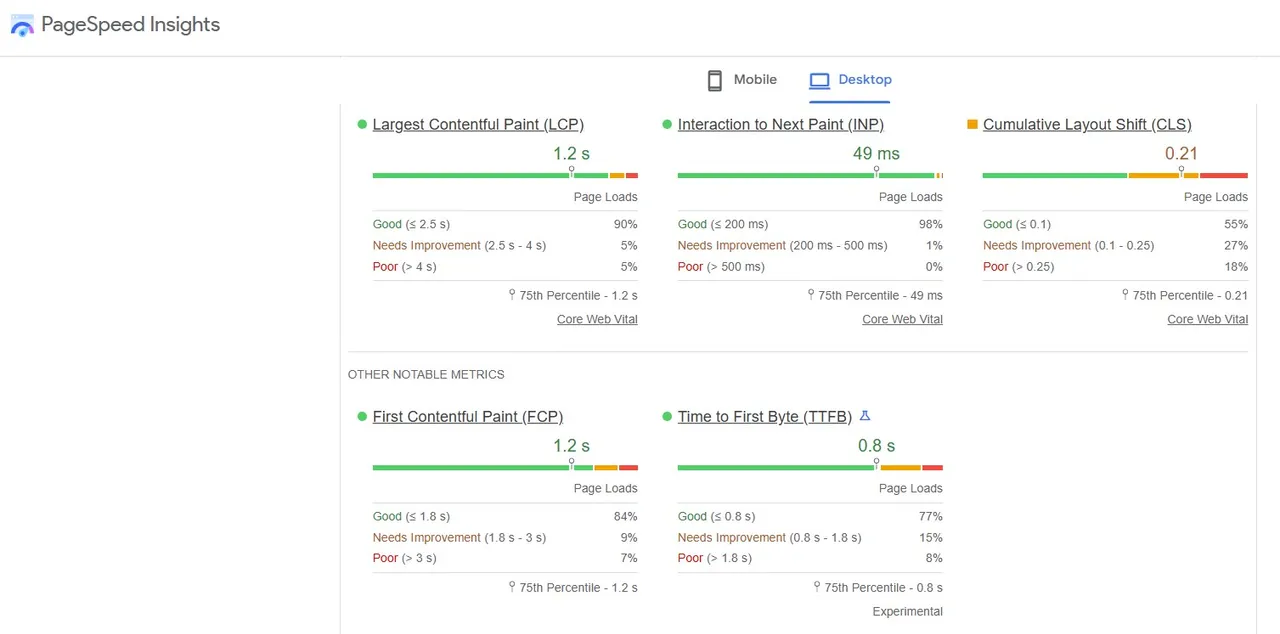
Google PageSpeed Insights combines lab data (simulated tests) with field data from real Chrome users. The field data shows how actual visitors experience your site, making it valuable for understanding real-world performance. It appears once a page or site has enough Chrome traffic.
For identifying specific LCP elements, open Chrome DevTools (F12), go to the Performance tab, and record a page load. The tool highlights exactly which element triggers your LCP measurement, helping you focus optimization efforts.
Work through these in order. The first three decide most LCPs:
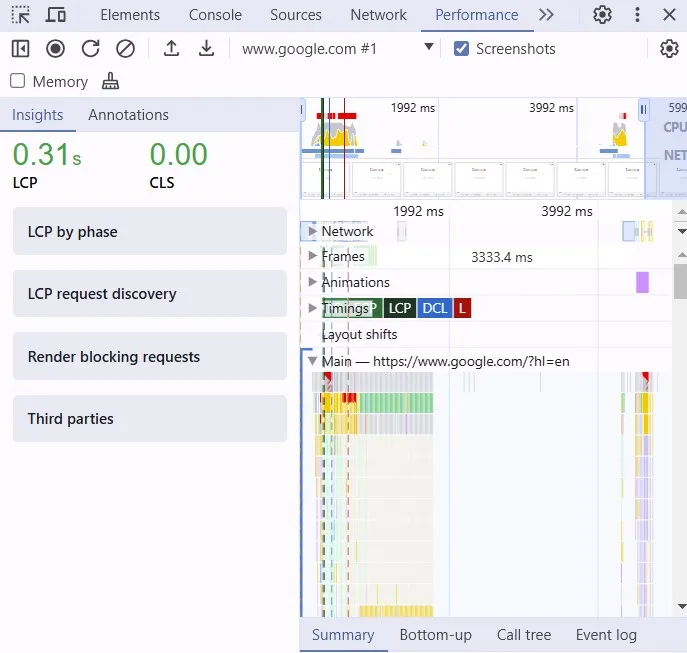
Before optimizing blindly, find out what's causing your LCP. In Chrome DevTools, right-click your page, select "Inspect," open the Performance tab, and click the reload button. The resulting timeline shows exactly which element triggers your LCP.
Don't assume it's the hero image. On the page-1 results we measured, the LCP element was text slightly more often than an image (47.0% against 42.6%). Knowing your specific element lets you target the right sub-part.
If your LCP element is an image, make sure the browser fetches it early and with priority:
loading="lazy" for below-the-fold images only.fetchpriority="high" to the LCP <img> so it jumps the download queue.<link rel="preload" as="image">.Then make the file itself cheaper to download:
srcset so phones don't download a desktop-width heroCSS and JavaScript in your <head> block rendering until they load. Solutions include:
defer or async attributes to script tags that don't need immediate executionWe hold our own site to this list. When we ran seomator.com through Lighthouse on 1 October 2026, the top items in the report were 253 KiB of unused JavaScript and render-blocking requests worth an estimated 150 ms.
Minification removes whitespace, comments, and unnecessary characters from your code. Most build tools (Webpack, Vite, Next.js) handle this automatically in production builds, so check that it's switched on before spending time elsewhere.
web.dev's guidance is that "most sites should strive to have a TTFB of 0.8 seconds or less" (web.dev). Strategies include:
You can check whether caching and compression headers are actually set with our HTTP header checker.
A Content Delivery Network serves your files from servers closest to each user, which shortens TTFB for a distant audience. Proper cache headers let returning visitors load your site almost instantly: set Cache-Control headers with appropriate max-age values, typically one year for versioned static assets and shorter durations for HTML.
If you're using a JavaScript framework, server-side rendering (SSR) sends fully-rendered HTML to browsers instead of requiring client-side JavaScript execution. This dramatically improves LCP for content-heavy sites. Frameworks like Next.js, Nuxt, and SvelteKit make SSR implementation straightforward.
An LCP over 4 seconds is considered "poor" by Google's standards. At this level, you're likely losing visitors before they see your main content. Even scores between 2.5 and 4 seconds ("needs improvement") should be prioritized for optimization.
Google measures Core Web Vitals separately for mobile and desktop visits, so each device's field data is judged on its own. Mobile is usually the harder one: connections are slower and devices less powerful, which is why the Web Almanac finds 62% of mobile pages with a good LCP against 74% on desktop.
Yes, and this is common. A desktop hero image might be hidden on mobile, making a text heading the LCP element instead. Test both viewport sizes to understand your actual LCP elements for each device type.
Monitor LCP continuously using Google Search Console's Core Web Vitals report or Real User Monitoring (RUM) tools. Run lab tests after any deployment that changes above-fold content, images, or loading behavior.
Adding larger images, more JavaScript, or render-blocking resources directly impacts LCP. When expanding content, always test performance impact and optimize new assets before deployment.
Use fetchpriority="high" when the image is already in the HTML; it raises the priority of a request the browser has already found. Use <link rel="preload" as="image"> when the image is discovered late, for example as a CSS background or an image inserted by JavaScript. Never lazy-load it.
fetchpriority="high" and never lazy-load; 16.3% of image-LCP pages in our sample didLargest Contentful Paint measures when your page's main content becomes visible—the moment users perceive your site as "loaded." As a Core Web Vitals metric, LCP feeds Google's ranking systems, but our October 2026 measurements show relevance still decides who ranks; speed decides who stays.
The path to better LCP is straightforward: identify your LCP element, optimize how it loads, and remove anything that delays rendering. For an image LCP that means priority and no lazy-loading; for a text LCP it means CSS, fonts and JavaScript.
Start by measuring your current LCP with SEOmator's speed test or Google PageSpeed Insights. Then apply the strategies in this guide, prioritizing changes to your specific LCP element.
Related Articles:
Who wrote it, what changed and how to tell us about a mistake.

Nick Sawinyh
Founder & CEO (2014–2026), SEOmator
Founded SEOmator in 2014 and led it as CEO until September 2026
Nick Sawinyh founded SEOmator in 2014 and led it as CEO until September 2026. He built it to make technical SEO auditing accessible to teams without a dedicated SEO engineer, and the articles below are the ones he wrote here about search strategy, algorithm shifts, and what actually moves rankings — usually with the audit data to back it up.

Isabella Edwards
Technical SEO Content Manager, SEOmator
Leads technical SEO content at SEOmator: audits, Core Web Vitals and on-page fixes
Isabella Edwards leads technical SEO content at SEOmator, turning crawl data, Core Web Vitals, and on-page signals into guidance teams can actually act on. She focuses on the practical side of search — auditing sites, fixing what holds rankings back, and explaining the reasoning behind each recommendation so non-specialists can follow along.
Published · Updated
Spot a mistake or a number that has gone stale? Tell us. We correct it and log the change in the History above. Report an error →
SEOmator Rank Tracker
Technical fixes are invisible until positions move. Track the keywords a fix was meant to affect and watch whether it actually landed.
SEOmator Rank Tracker· 14 min read
Slow mobile LCP is the single most-failed rule across the 100,000+ sites we audited in 2026. Find which metric failed, fix it, and pass the assessment.

· 16 min read
Benchmark your site against real 2026 data: Cloudflare Radar crawl ratios, Web Almanac Core Web Vitals pass rates, and post-AI-Overview CTR — every figure sourced and dated.
· 16 min read
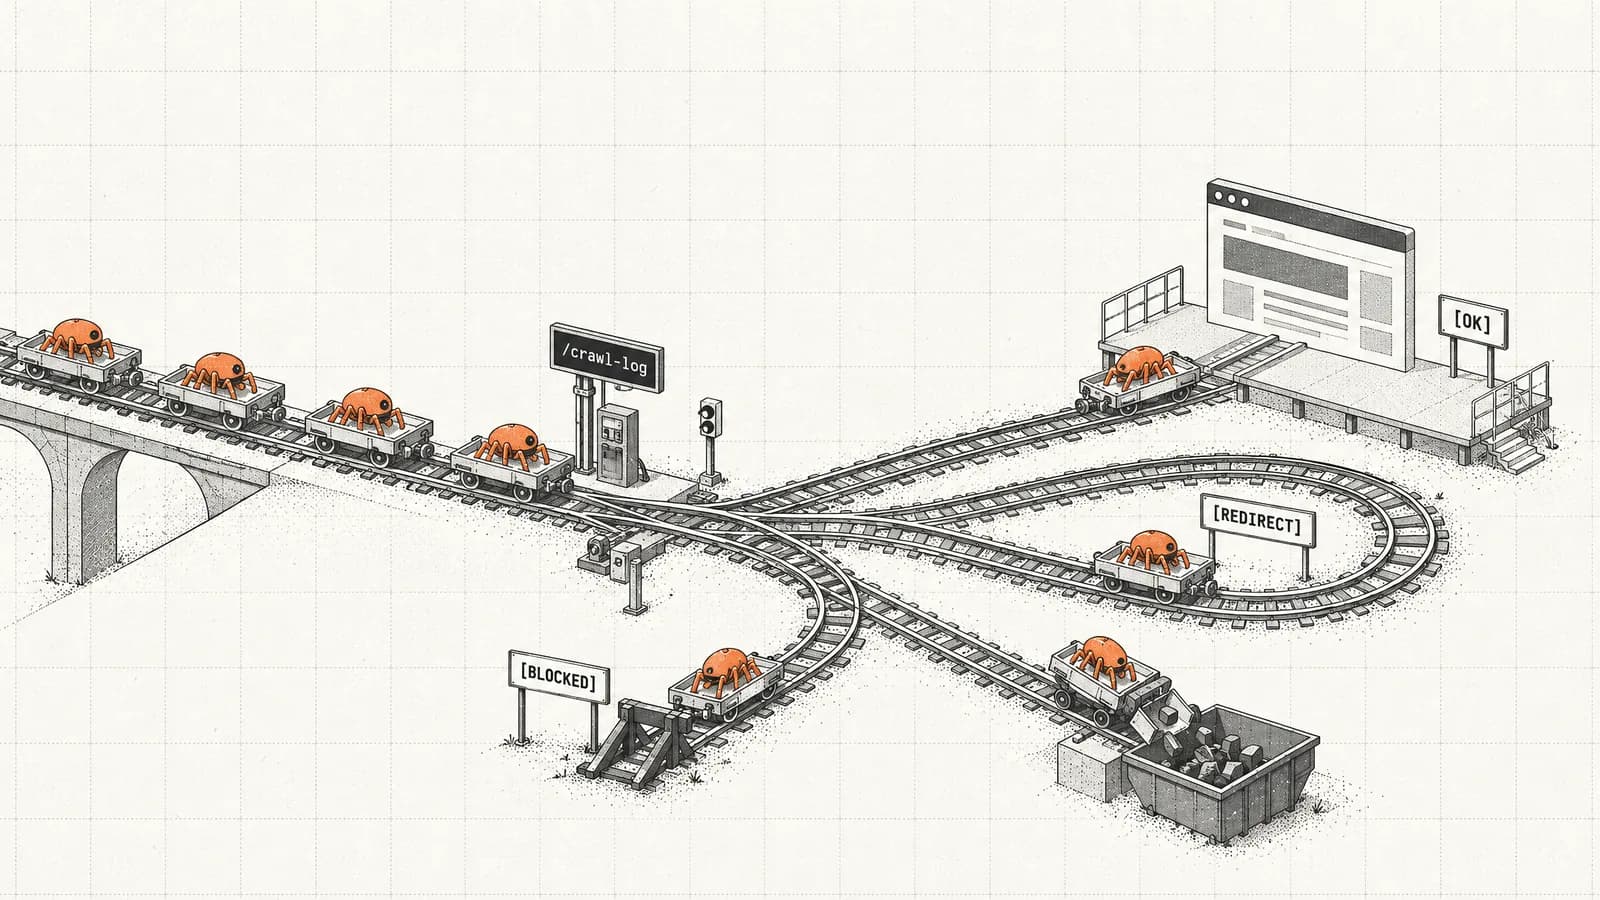
Only 45.9% of crawler requests return a 200. The 2026 crawl waste report breaks the waste down by client type, industry, and operator — and finds AI bots are the cleanest traffic on the web, not the dirtiest.


