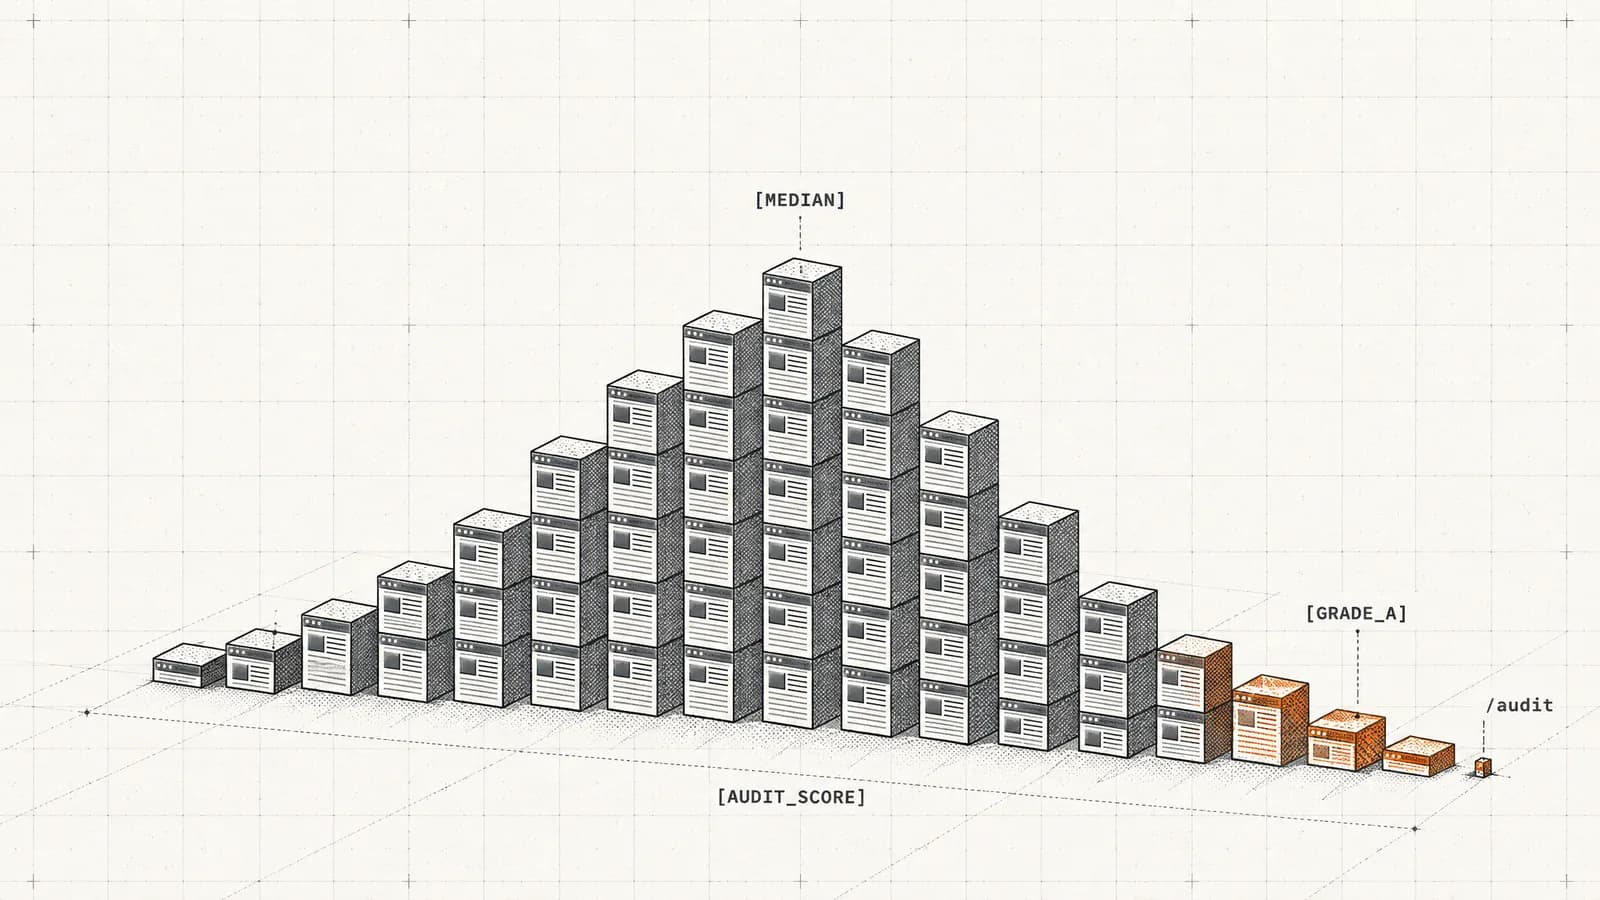
You test your site on an idle connection. Your users are never on one. Across Cloudflare's global speed measurements for the 28 days to 14 July 2026, median latency on an idle connection is 97.9ms. Under load — which is to say, while the page is actually downloading — it is 257.1ms. Google's INP threshold is 200ms. The network alone has spent the entire interaction budget before a single line of your JavaScript executes.
That is the statistic this page exists for, and almost no speed guide mentions it, because almost no speed guide tests the way a user browses. The first thing I check when a site "feels fast to us but users keep complaining" is exactly this gap. I throttle the connection and test under load before I read a single line of the code.
The numbers that actually apply to your users
| Measurement | Idle | Under load | Change |
|---|
| Latency | 97.9 ms | 257.1 ms | 2.6× worse |
| Jitter | 30.5 ms | 66.6 ms | 2.2× worse |
| Packet loss | — | 2.34% | — |
| Download bandwidth | 119.9 Mbps | — | — |
Source: Cloudflare Radar quality/speed (radar.cloudflare.com), 28-day window ending 14 July 2026. These are RAW measured values in ms and Mbps, not indices. The data is Cloudflare's; the reading of it is ours.
And now the number that should worry you more. That 119.9 Mbps download figure comes from speed.cloudflare.com — people who chose to run a speed test, which selects hard for people with good connections. Cloudflare also publishes a deliberately conservative estimate across the whole population, the Internet Quality Index:
| Percentile | Bandwidth | Latency | DNS response |
|---|
| 25th | 7.6 Mbps | 52.3 ms | 34.1 ms |
| 50th (median) | 12.7 Mbps | 75.1 ms | 57.2 ms |
| 75th | 22.3 Mbps | 110.2 ms | 100.4 ms |
Source: Cloudflare Radar quality/iqi (radar.cloudflare.com), 28-day window ending 14 July 2026. RAW_VALUES — real Mbps and milliseconds.
The median connection is 12.7 Mbps, not 120. The gap between those two numbers is the gap between the machine you build on and the phone your customer is holding. A 3MB hero image is a 0.2-second problem on your laptop and an ~1.9-second problem at the median. Same image, same site, entirely different business outcome.
Three things follow, and they are the whole point of this page:
- Lab scores are not the ranking input. Google ranks on field data (CrUX, 75th percentile of real users) — the 75th percentile in the table above, not the number your laptop reports. A green Lighthouse score on a 120 Mbps idle connection tells you almost nothing about the metric you are actually graded on.
- INP is a network problem before it is a JavaScript problem. At 257ms of loaded latency you are over the 200ms threshold on the network alone. Every long task you then add is on top of an already-blown budget.
- Test under load, on a throttled connection, or you are measuring the wrong site. Run a real speed test and read the blocking resource, not the score.
🔑Key Takeaway: Google grades you on field data — the 75th percentile of real Chrome users in CrUX — not the lab score your laptop reports. If you only ever test on your own fast connection, you are optimizing a site your customers never see.
Below: what load time is, what breaks it, and the fix order that recovers the most time per hour of work.
What is Website Load Time?
In simple terms, website load time is the total time taken by your site to fully display the content on a specific page. It’s the duration from clicking a link to seeing the complete content on that page load on your screen.
However, website load time is more than how swift pages on your site load. It’s also about a smooth, bug-free, and enjoyable user experience.
Very similar but slightly different, page load time is the period between the initial request for a URL and the point when the page's content completes the loading process. It’s a reflection of your site's efficiency and how well it delivers content to your users.
In 2026, the metric Google actually scores is more specific than "load time." Largest Contentful Paint (LCP) measures when your main content appears, Interaction to Next Paint (INP) measures how fast the page responds to a tap or click, and Cumulative Layout Shift (CLS) measures visual stability. Together they are the Core Web Vitals, and INP replaced First Input Delay (FID) as an official Core Web Vital in March 2024 — a much harder bar to clear, which is why so many sites that "passed" before now fail.
I keep tabs on all three because together they're the closest proxy Google hands us for what a real user actually feels. In the audits I run, INP is where I watch the most sites quietly slip from "passing" to "failing," and it's usually the reason an owner can't work out why good content isn't ranking the way they expected.
Why Do Fast Website Loading Times Matter?
Fast loading times matter because speed is directly tied to revenue and rankings: a 0.1-second (100ms) improvement in mobile site speed lifted retail conversions by 8.4% and average order value by 9.2% in Google and Deloitte's study of 37 brands and 30M+ sessions. Slow pages leak money at every step, and Google's algorithm can see it. When I audit a site that's plateaued, speed is one of the first things I rule in or out, because it's the rare fix that can move conversions and rankings at the same time.
One look at page speed trends and you’ll see a clear shift towards speedier websites, fueled by the increasing demands of users and search engines alike.
Here’s why:
✅ User Experience: If your website takes more than a few seconds to load, it could seriously frustrate your users. And when users aren't happy, they have the entire internet at their fingertips to find alternatives.
✅ Conversion Rates: Web pages with quicker load times have higher average transaction sizes and lower bounce rates. There's a clear equation here: Speed equals revenue. According to Google and Deloitte's Milliseconds Make Millions study, shaving just 0.1s off mobile load time raised retail conversions 8.4% and travel conversions 10.1%. And in Portent's analysis of 100M+ pageviews, conversion rates fell an average of 4.42% for every additional second between 0 and 5 seconds — a site that loads in one second converts at 39%, versus 18% at six seconds.
✅ SEO and Website Ranking: Website speed is one of the signals Google uses to rank pages. Core Web Vitals feed Google's ranking systems, so a slow, unstable page is graded down before you touch content or links. If your site is failing the assessment, start with our guide to fixing a failed Core Web Vitals report — and see how load speed impacts SEO for the ranking mechanics.
📊By the Numbers: A 0.1s mobile speed gain lifted retail conversions 8.4% and average order value 9.2% across 37 brands and 30M+ sessions (Google + Deloitte). Speed is not a vanity metric — it is a line item.
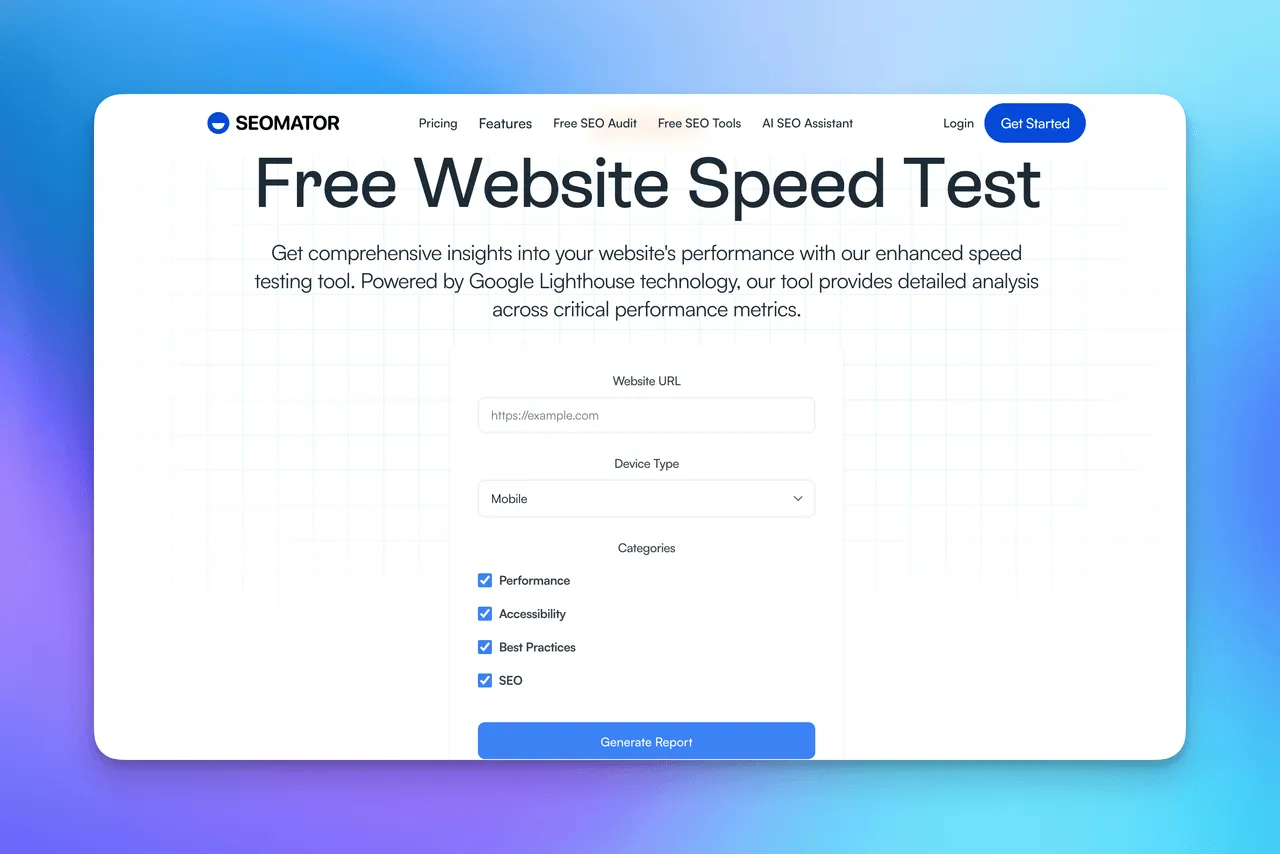
🚀 We built SEOmator’s Free Website Speed Test Tool for exactly this — run your page through it to see the real load time, then take the steps to make it faster.
Which Factors Can Impact Your Website Load Time?
The biggest factors are hosting and server response time, total page weight (especially unoptimized images), and render-blocking or third-party JavaScript. On most sites in 2026, unused third-party scripts — tag managers, chat widgets, ad tags — are the single largest cause of a failing INP.
When I open a slow site's network waterfall, the heaviest rows are rarely the code the team wrote. They're the third-party tags someone pasted in months ago and forgot about.
Here are some weighty variables you need to consider:
⏳ Web Hosting: Choose your host wisely! The type of hosting you select can dramatically impact your website's load time.
⏳ Website Size: We love high-resolution images and videos, but the bigger the file size, the longer it takes to load. It's a fine balance you need to strike.
⏳ Website Traffic: More traffic can slow down your server response time. Ensure your server can handle high traffic volumes.
⏳ Plugins & Widgets: They might be handy, but too many can affect your website speed. Be selective.
⏳ Platform and CMS: The efficiency of your website platform and CMS can significantly influence how quickly your content gets delivered.
⏳ Coding: Clean, optimized coding aids faster web page loading. Ensure your site is coded efficiently.
⚠️Common Mistake: Blaming "the code" first. Across most audits, the dominant cost is third-party scripts you added yourself — not your own markup. Cut the tags you can't justify before you refactor a single component.
Attention to these factors means you're already on your way to achieving blazing fast website speeds!
What are the Most Important Website Load Time Statistics?
The measured figures at the top of this page are the ones we would act on. The widely-cited industry statistics below are worth knowing because everyone quotes them at you — but note as you read that most are several years old, several have no traceable original researcher, and none of them measured your users' connection.
📊 While there may not be a definitive "golden number," Google suggests that most users expect a web page to load in under 3 seconds.
Yes, you heard right, just three little seconds.
📊 According to a study, Google.com has an average speed index value of just 0.77 seconds.
Speed is a confirmed ranking input — Core Web Vitals feed Google's ranking systems, and the field data behind them is the 75th-percentile column in the table above, not a lab score.
📊 A study suggests that the average page speed of a website that appears on the first page of a Google SERP is 1.65 seconds.
However, the loading time of an average website is slower than that.
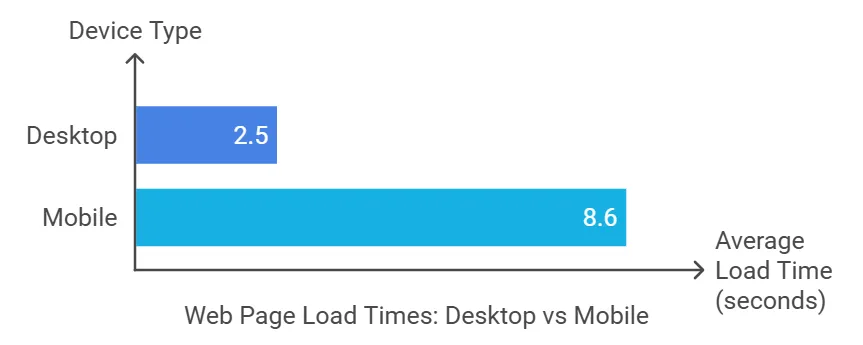
📊 The average web page load time is 2.5 seconds on desktop and 8.6 seconds on mobile, according to a study. It’s vital to note that web pages on mobile devices take on average 70.9% longer to load than on desktop.
So, try not to let your website load time go above 2 seconds to satisfy those quick-browsed users and maintain a competitive online presence.
With that being said, have you ever stopped to ponder over how much of our lives now revolve around mobile devices? Socializing, shopping, watching movies, reading news - we do it all on our mobiles.
📊 Research shows that 53% of mobile site visitors leave a page if it takes longer than 3 seconds to load.
In a mobile-driven world, the expectations only skyrocket.
📊 According to a recent Forbes Advisor survey, people are willing to wait for a website to load for eight seconds on average. 4% will wait less than 3 seconds, 29% will wait 3 to 6 seconds, 38% will wait 7 to 10 seconds and 24% will wait more than 11 seconds.
If you want those transaction bells to keep ringing, focus on your website speed statistics.
📊 Studies suggest that slow-loading websites lead to an annual loss of $2.6 billion in sales for businesses.
So, the quicker your site, the higher the satisfaction, interaction, and conversions.
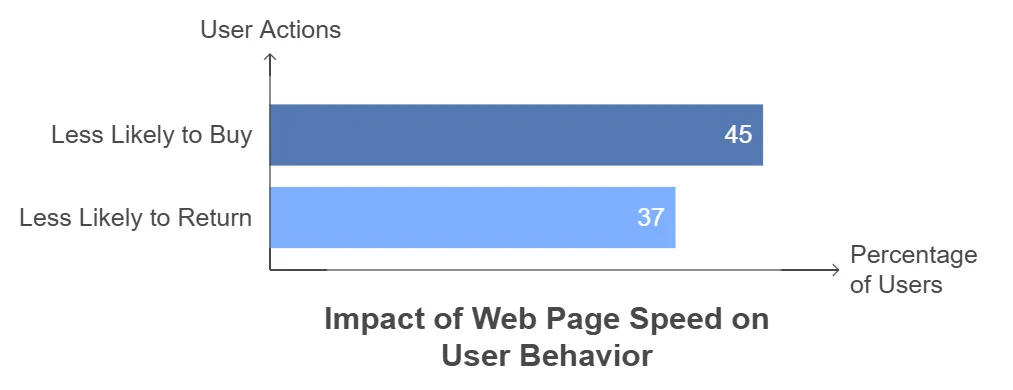
📊 A survey found that when web page speed was slower than a visitor expected, 45% of the users were less likely to buy and 37% were less likely to return to the website.
📊 Also, a research shows that 64% of online shoppers who have a poor user experience on a website will change their mind and choose to go shop at another store.
That means, fast website loading time can absolutely give you a competitive edge.
📊 A research reveals that users would prefer to miss out on animation or a video if it meant getting faster load times.
So, although flashier animations and engaging videos promise more traffic, you should absolutely be careful that they don’t slow down your loading time.
These statistics are an eye-opener, aren't they?
If you need a current, sourced benchmark rather than a recycled one, these are the numbers to bring to the meeting:
- Only 48% of mobile sites pass all three Core Web Vitals, up from 44% in 2024, according to the 2025 Web Almanac (built on Chrome real-user data). On mobile, roughly 62% hit good LCP, 77% hit good INP, and 81% hit good CLS — LCP is now the hardest of the three to pass.
- INP is the metric with the widest device gap. The Web Almanac puts mobile INP pass rates near 77% against ~97% on desktop — the same site can feel instant on a laptop and sluggish on the phone your customers actually use.
- The median mobile connection is ~12.7 Mbps (Cloudflare's IQI, above), not the 120 Mbps your build machine reports. That single fact reframes every "it's fast on my end" conversation.
📊By the Numbers: In 2025, fewer than half of mobile sites (48%) passed all three Core Web Vitals — meaning the majority of the web is failing the exact assessment Google folds into rankings.
Our digitally driven society thrives on the need for speed. From fast-food to fast cars, we're always in a hurry, and the digital world isn't immune to this trend. When it comes to browsing the internet, patience is in short supply!
How Can You Improve Your Website Loading Speed?
Start where the time actually goes: compress and serve next-gen images, cut render-blocking and third-party JavaScript, put a CDN in front of your assets, and keep server response time (TTFB) under 200ms. Fix in that order and you recover the most time per hour of work.
I'd work that list top to bottom and re-measure after each change, because the biggest time sink I see is teams optimizing in the wrong order — a week spent compressing images when a single render-blocking script was the whole problem. Fix the thing that's actually on the critical path first, then move down.
Here are some strategies to speed up your loading time:
🔄 Lower HTTP Requests: Historically, over 80% of a web page's load time was spent downloading images, stylesheets, and scripts — one HTTP request per element. With HTTP/2 and HTTP/3 multiplexing now standard, bundling every file into one is no longer the win it was on HTTP/1.1. The bigger lever in 2026 is cutting the requests you don't need at all — especially unused scripts — and deferring non-critical JavaScript so it doesn't block the first paint.
🔄 Enable Compression: Large pages (often 100kb and more) are slower to download. Compress your text assets — prefer Brotli over the older gzip where your server supports it — using built-in directives or modules. It's one of the cheapest wins available.
🔄 Enable Browser Caching: When you visit a website, the elements on the page are stored on your hard drive in a cache. This means that the next time you visit the site, your browser can load the page without having to send another HTTP request to the server. Enable caching and your load time will significantly decrease.
🔄 Reduce Image Sizes: Images are still the heaviest part of most pages, so this is usually the fastest win. Serve next-gen formats (AVIF or WebP) instead of PNG/JPEG, size each image to the container it renders in with responsive srcset, and lazy-load anything below the fold. Never ship an image larger than it needs to be.
🔄 Cut Third-Party Scripts: Tag managers, chat widgets, A/B-testing snippets, and ad tags run on the main thread and are the single biggest cause of a failing INP. Audit every third-party tag, remove what you can't justify, and load the rest with async or defer. Our crawler makes this quick to see: a full site crawl shows which templates carry the heaviest third-party payloads.
🔄 Avoid Redirects: Each time a page redirects to another page, your visitor faces extra waiting time for the HTTP request-response cycle to complete. Minimize them to increase your site speed.
🔄 Remove Duplicate Scripts: Duplicate JavaScript and CSS files are common and can impair page load times. Even though it may not seem like a significant issue, these create unnecessary HTTP requests and add page weight.
🔄 Improve Server Response Time: Server response time is the amount of time it takes for a web server to respond to a request from a user’s browser. Several factors can slow it down: slow application logic, slow routing, frameworks, resource-starved CPUs, and slow database queries. Ideally it should be under 200ms — this is your Time to First Byte (TTFB), and it sets the floor for your LCP.
🔄 Use a Content Delivery Network (CDN): Copies of your site are stored at multiple, geographically diverse data centers so that users have faster and more reliable access to your site — which directly attacks the latency numbers in the tables above.
🔄 Optimize CSS: CSS holds the style requirements for your page, and browsers won't render the page until the CSS loads. Inline the critical "above the fold" CSS directly in your HTML so the visible content renders immediately, then defer the rest.
💡Quick Insight: Don't guess at the order. A single audit surfaces the render-blocking resource, the oversized image, and the slow TTFB in one pass — start with the
free SEO audit we built, then re-test under load to confirm the fix landed.
Frequently Asked Questions
What is a good page load time in 2026?
Aim to fully load in under 2.5 seconds and keep interactions responsive. In Core Web Vitals terms that means LCP under 2.5s, INP under 200ms, and CLS under 0.1 — measured on real users (the 75th percentile in CrUX), not on your own idle connection.
Does page speed affect SEO and rankings?
Yes. Core Web Vitals are a confirmed input to Google's ranking systems. Speed alone won't outrank stronger content, but a slow, unstable page is graded down — and it depresses the click and dwell signals Google also watches.
What replaced First Input Delay (FID)?
Interaction to Next Paint (INP) became an official Core Web Vital in March 2024, replacing FID. INP measures the full latency of interactions across the whole visit, so it's a much harder metric to pass than the old FID.
What is a good INP score?
Under 200 milliseconds is "good," 200–500ms "needs improvement," and above 500ms "poor." In 2025 roughly 77% of mobile sites hit the good threshold, but high-traffic, script-heavy sites struggle most.
Why is my site fast for me but slow for visitors?
Because you test on an idle, high-bandwidth connection and your users don't. The median mobile connection is around 12.7 Mbps with latency that roughly doubles under load — always test on a throttled connection and read field data, not lab scores.
How do I measure my real load time?
Run a free website speed test under realistic conditions, then use Chrome's CrUX field data or an audit tool to see the 75th-percentile numbers Google actually ranks on.
Final Thoughts

The digital world is fiercely competitive, where the quest for speed is constant and growing. And every millisecond counts!
As users grow more impatient, search engines grow more demanding, and competition increases, those precious seconds will undoubtedly play a decisive role in determining your online success — and with only 48% of mobile sites passing Core Web Vitals, the bar is still low enough that getting this right is a genuine edge.
If I had to leave you with one habit, it's this: stop testing on your own connection. Throttle it, test under load, and read the field data your users generate — that single change surfaces more real problems than any score I've ever read off an idle laptop.
However, speed is not just about rapid page loads. It's also about a smooth, bug-free, and enjoyable user experience on your website. From the moment a user lands on your page until they leave, across every single interaction – speed matters at all levels!
Methodology and sources
The measured numbers at the top of this page are Cloudflare's, not ours — and they are labelled that way everywhere they appear. We could not measure the latency of the global internet; Cloudflare sits in front of a large share of it and can. Where they have the better instrument, we cite them and say so.
Source: Cloudflare Radar (radar.cloudflare.com) — quality/speed (aggregate speed-test measurements) and quality/iqi (the Internet Quality Index, a deliberately conservative percentile band across the whole measured population). Both are a 28-day window ending 14 July 2026, and both are normalized as RAW_VALUES: they are real milliseconds and real megabits, not indices or shares.
Two caveats we would rather state than bury. The speed-test aggregate is self-selected — a person who runs a speed test is more likely to have a connection worth testing, which is exactly why the 119.9 Mbps download figure and the 12.7 Mbps IQI median disagree so violently. That disagreement is not an error; it is the finding. And these are network measurements, not page measurements: they tell you the conditions your page has to survive, not how your page performs. For that, run it: free website speed test.
The industry statistics further up are third-party, each linked to its source. Several date from 2023–2024 and are reproduced here because they are the ones you will be quoted in a meeting, not because we think they beat a current measurement — which is why we added the 2025 Web Almanac and Google/Deloitte figures alongside them.
🚀 You may also want to read:
- How to Recover Your SEO Rankings in 9 Steps
- How Load Speed Impacts SEO
- How to Fix a Failed Core Web Vitals Assessment