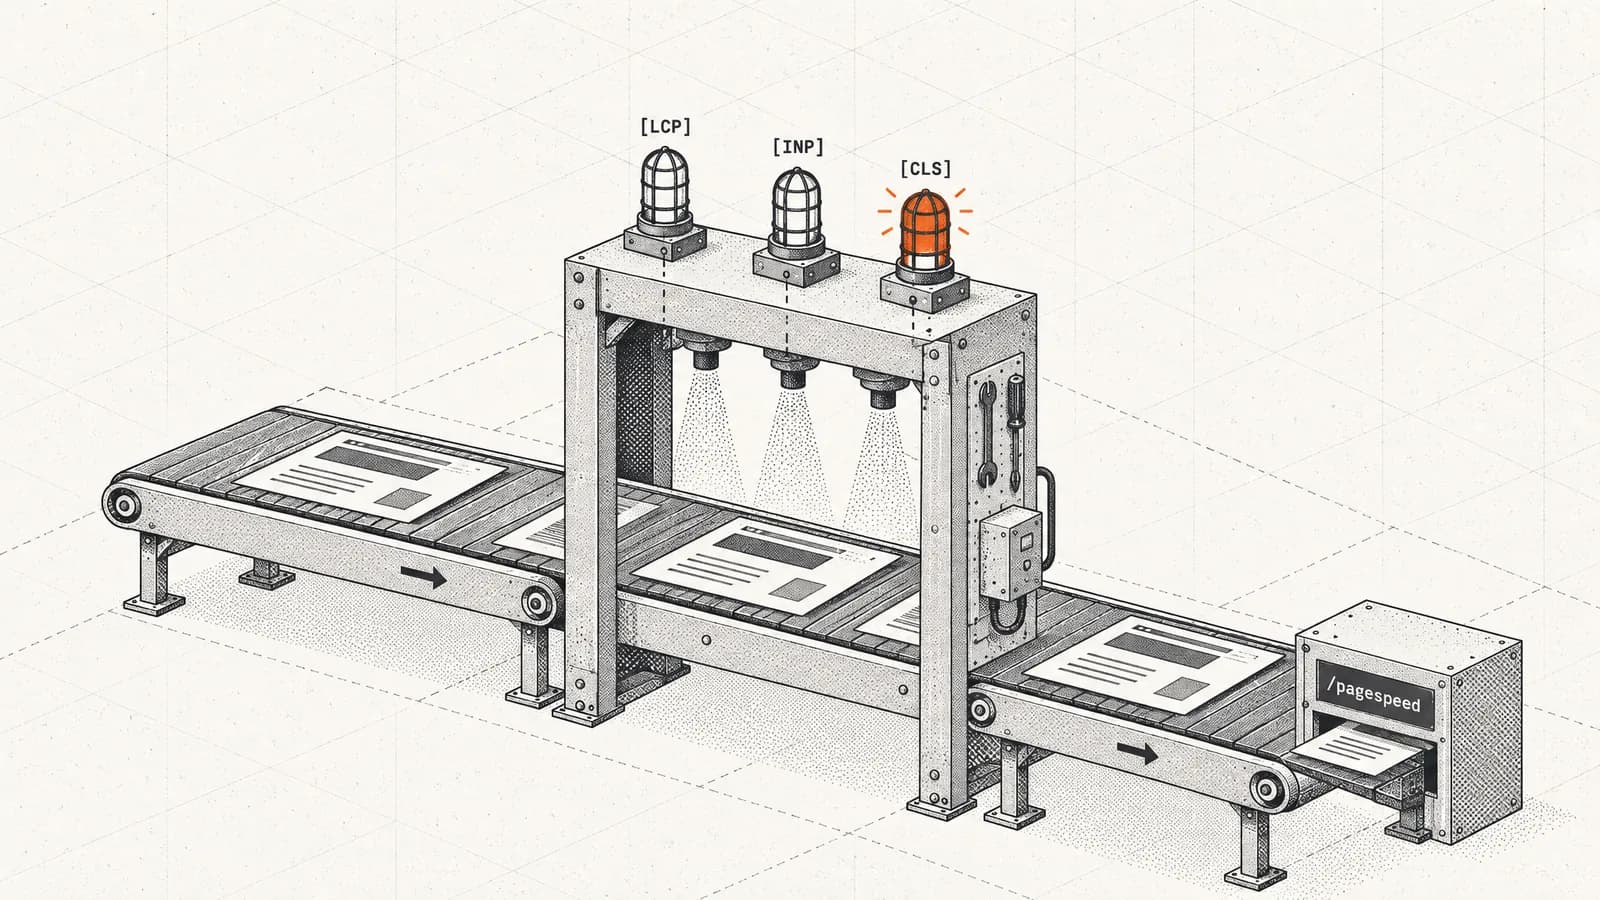
A failed Core Web Vitals assessment means fewer than 75% of your real visitors got a "good" score on at least one of LCP, INP, or CLS over the last 28 days. It is a field-data verdict, not a lab score — which is why a page can show 100 in Lighthouse and still fail. Fix the failing metric, then wait out the 28-day window.
Quick verdict: Don't start optimizing. Start by identifying which of the three metrics failed, and on which device. Google grades mobile and desktop separately, at the 75th percentile of real visits. Roughly nine times out of ten the answer is mobile LCP — and the fix is usually server response time or the hero image, not the JavaScript everyone reaches for first.
Across the 100,000+ websites we audited with our 251-rule engine between January and July 2026, LCP above 2.5 seconds on mobile was the single most-failed rule on the entire list — 58.4% of sites fail it. Performance is the most-failed category overall, tripping 71.2% of sites. So if you just found a red "Failed" banner, you are firmly in the majority, and the path out is well worn.
📊By the Numbers: Across the 100,000+ sites we audited between January and July 2026, mobile LCP over 2.5s is the #1 most-failed rule (58.4% of sites). INP over 200ms is #9, at 29.6%. Loading is roughly twice the problem responsiveness is.
What are the three Core Web Vitals, and what counts as a pass?
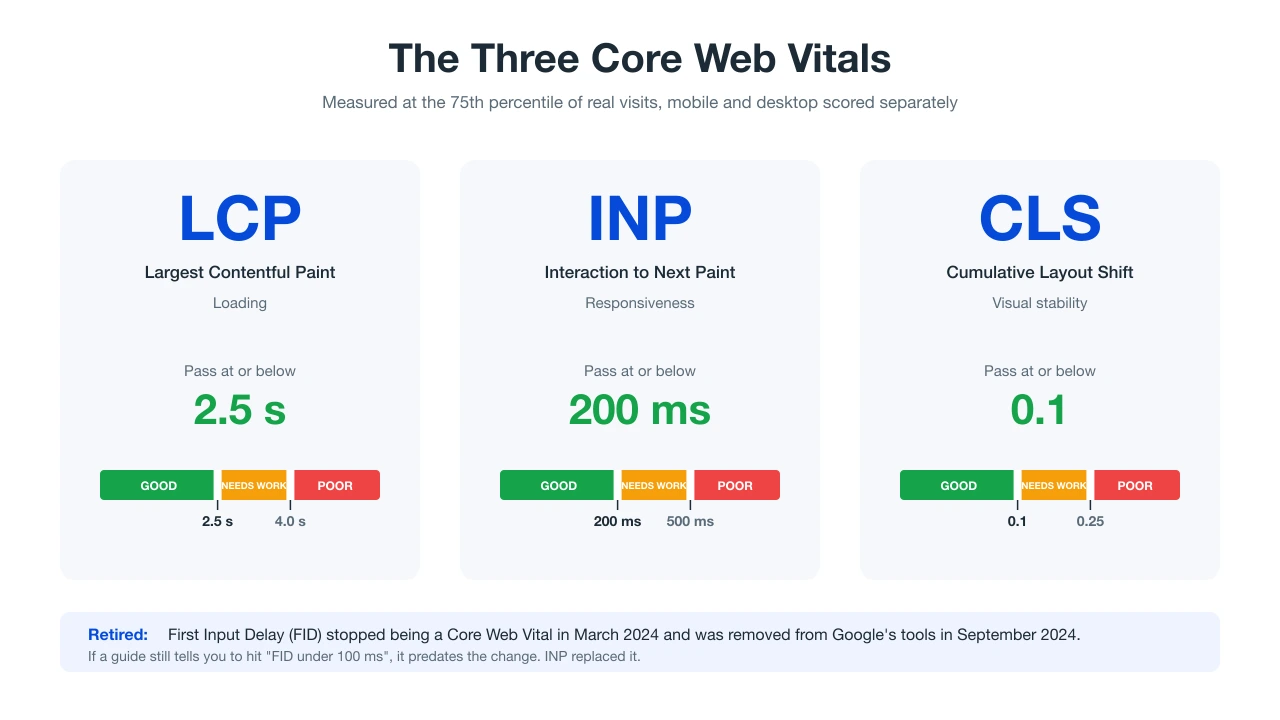
Three metrics, three thresholds. A page passes only if all three clear the "good" bar at the 75th percentile.
Two details in that table do most of the damage when people miss them.
"75th percentile" is not an average. Google sorts every recorded visit from fastest to slowest and looks at the visit three-quarters of the way down. Your median user can be having a great time while you fail, because the assessment is grading the experience of your slower quarter — old Androids, weak signal, cold caches.
Mobile and desktop are scored separately. Passing on desktop earns you nothing if mobile fails. According to Google's Core Web Vitals documentation, targets should be met "at the 75th percentile of page loads, segmented across mobile and desktop devices."
Wait — where did FID go?
If you're following an older guide, it will tell you to keep First Input Delay under 100 ms. That advice expired. INP replaced FID as a Core Web Vital on 12 March 2024, and Google gave developers until 9 September 2024 to move over before FID left the tooling.
This matters more than a terminology swap, and it is the reason a lot of sites that had passed for years suddenly started failing.
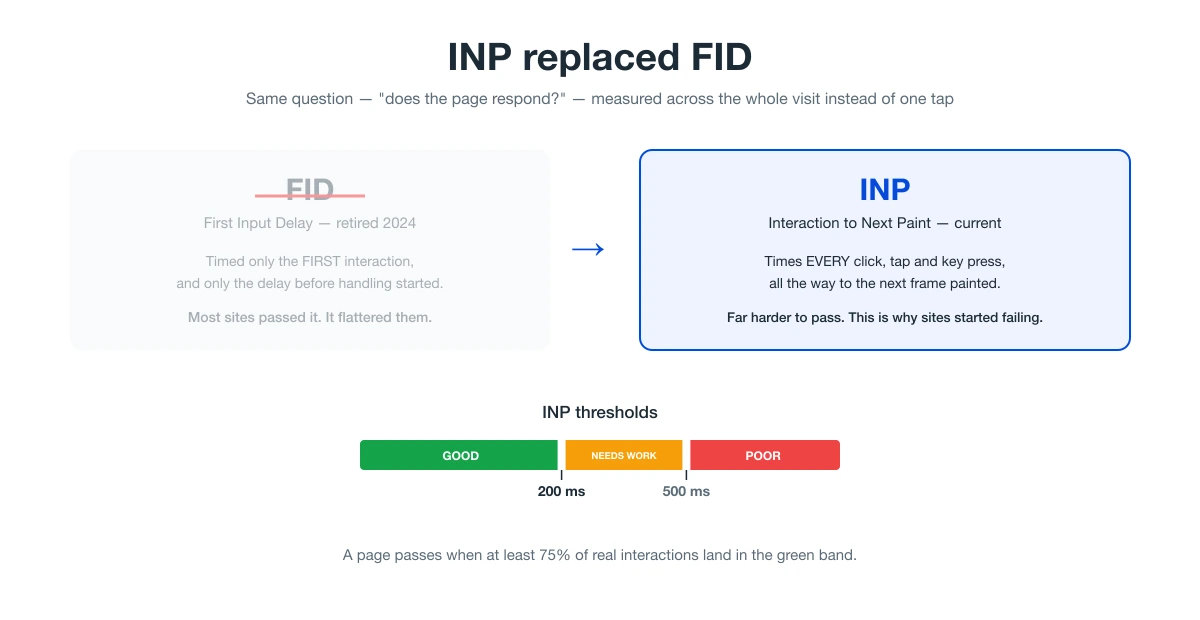
FID only timed the first interaction, and only the delay before the browser began handling it. It was a generous metric and almost everybody passed. INP times every interaction across the whole visit, all the way through to the next frame painted. According to Fasterize's analysis of Chrome usage data, about 90% of the time a user spends on a page happens after it has loaded — which is precisely the window FID never looked at and INP now grades.
⚠️Common Mistake: Reviving an old FID checklist. If a guide, plugin description or agency audit still tells you to target "FID under 100 ms", it predates March 2024 and its responsiveness advice is aimed at a metric Google no longer measures.
Why does the assessment say "Failed" when PageSpeed shows 100?
This is the question I get sent screenshots about more than any other, and the answer is almost always the same: you are reading two different numbers and assuming they're the same number.
PageSpeed Insights shows you two things stacked on one page:
- Field data (top) — real Chrome users, drawn from the Chrome User Experience Report (CrUX). This is what the Core Web Vitals assessment grades. It is the only thing that decides Passed or Failed.
- Lab data (bottom) — a single simulated load run by Lighthouse on a throttled connection, right now. This is the big colorful 0–100 Performance score.
The 0–100 score has no bearing whatsoever on the assessment. You can score 100 and fail. You can score 62 and pass. The first thing I check on any "Failed" report is whether the person is looking at the top half of the page or the bottom half, and it's the bottom half more often than not.
Three more mismatches explain most of the rest:
- Your test conditions aren't your users' conditions. You're testing on office fiber with a warm cache and a modern laptop. The 75th percentile is a three-year-old mid-range Android on patchy 4G.
- The data is 28 days old, rolling. CrUX reports a trailing 28-day window. A fix you deployed on Tuesday is diluted by 27 days of the old experience.
- You might not be looking at your page at all. More on this next — it's the sneakiest one.
📌Pro Tip: Use field data to decide whether you have a problem and which metric it is. Use lab data to work out why. Lighthouse is a debugger, not a verdict — and it can't see your real users at all.
How Search Console groups your URLs (and why one bad template fails hundreds of pages)
The Core Web Vitals report in Search Console doesn't grade URLs one at a time. It bundles them into groups of pages with a similar experience — usually a template. All your product pages become one group; all your blog posts become another.
Two consequences catch people out:
- A group's status is set by its worst metric. Good LCP and good CLS won't save a group whose INP is poor. One failing metric fails the group.
- When a URL group has too little traffic to report privately, Search Console falls back to an origin-level group covering every URL on the domain. So the "Failed" you're staring at may be describing your whole site's average experience, not the page you tested. This is exactly why people fix one landing page, see no movement, and conclude Core Web Vitals is broken.
Fix at the template level. Fixing a single URL inside a failing group moves the group's 75th percentile by almost nothing.
Which metric actually failed? Diagnose before you optimize
Skipping this step is the most expensive mistake available to you. Our audit data shows performance failures cluster hard: mobile LCP fails on 58.4% of sites while INP fails on 29.6%, so the odds are that the JavaScript work most teams start with isn't the thing holding them back.
Work through this in order. It takes about ten minutes.
- Open PageSpeed Insights and enter the URL. Read only the top section, "Discover what your real users are experiencing."
- Switch to the Mobile tab first. Desktop passing is not evidence of anything.
- Write down which of the three bars is amber or red, and the actual number. "LCP 4.1s mobile" is a work order. "The site is slow" is not.
- Check whether it says URL or Origin. If PSI reports origin-level data, this page has too little traffic of its own and you're seeing a site-wide figure.
- Open Search Console → Core Web Vitals and find which URL group is failing and how many URLs sit in it. That's your blast radius.
- Now, and only now, run the lab tools to find the cause of that one metric on that one template.
If PSI shows "no data" rather than a pass or fail, the page simply has too few Chrome visitors to report on. You aren't failing — you're invisible. Optimize using lab tools and the origin-level trend instead.
🔑Key Takeaway: One metric, one device, one template. Every hour you spend before you can name all three is guesswork — and it's usually spent on JavaScript when the real cost was a 900 KB hero image.
Our free website speed test gives you the lab side of this in one pass, running the same performance rules that produced the failure rates above — so you can see where your site sits against the 100,000+ we've audited.
How do you fix a failed LCP?
LCP is the loading metric — the time until the largest visible element (usually a hero image, sometimes a heading or a video poster) finishes rendering. It's the most common failure by a distance, and it's the most fixable.
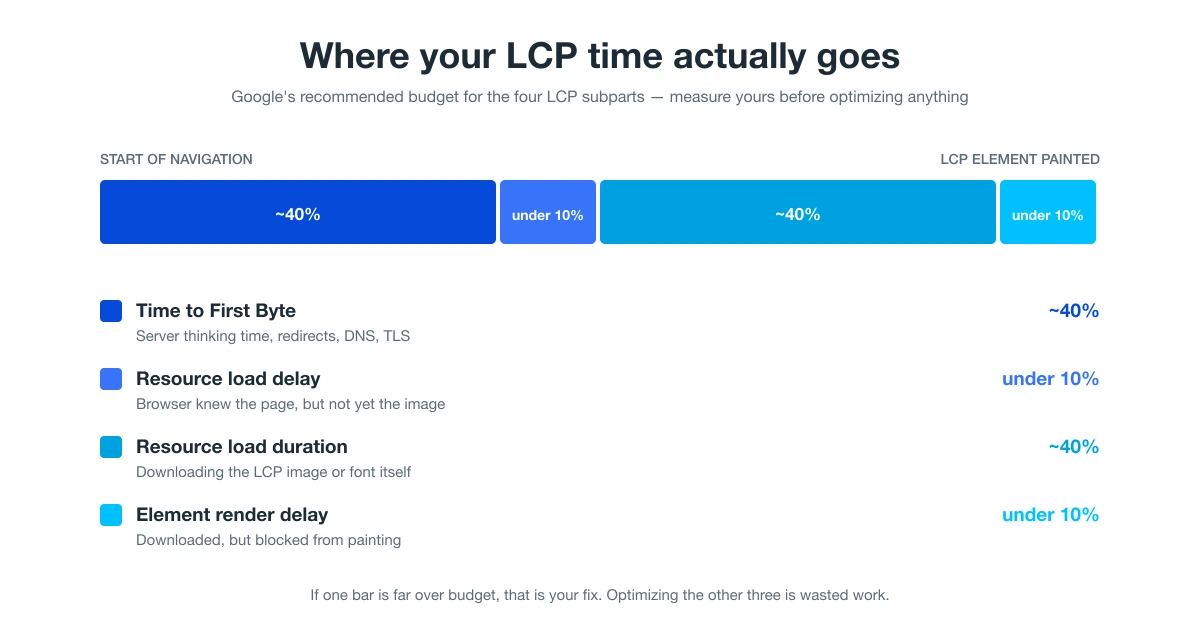
The trick is to stop treating LCP as one number. Google breaks it into four subparts, each with a rough budget:
| Subpart | Budget | What it actually is |
|---|
| Time to First Byte | ~40% | Server thinking time, redirects, DNS, TLS |
| Resource load delay | under 10% | Browser knows the page but hasn't started fetching the LCP image |
| Resource load duration | ~40% | Downloading the LCP image or font itself |
| Element render delay | under 10% | Downloaded, but something is blocking the paint |
Measure yours, find the bar that's wildly over budget, and fix that. Optimizing the other three is wasted effort. In our audit data, sites that fail mobile LCP overwhelmingly fail on the first and third bars — server time and image weight.
If TTFB is your problem (over ~800 ms), no amount of image compression will help. Look at hosting quality, database queries, missing page caching, and redirect chains — every hop costs a full round trip. A CDN helps here because it serves cached content from a server near the user rather than from your origin.
If resource load duration is your problem, the hero image is too heavy. Serve modern formats — WebP or AVIF, both of which compress far harder than JPEG or PNG at the same quality. Size the image to the largest space it will actually occupy on a phone, not to your desktop mockup. Use responsive srcset so mobile doesn't download a 2000px file to display at 390px.
If resource load delay is your problem, the browser found out about the image too late. Preload it and mark it high priority:
<link rel="preload" as="image" href="/hero.avif" fetchpriority="high">
Two rules that go together: never lazy-load the LCP image (that's the one image on the page guaranteed to be in the viewport), and do lazy-load everything below the fold so it doesn't compete for bandwidth.
If element render delay is your problem, something is blocking the paint — usually render-blocking CSS or a webfont. Inline the critical CSS needed for above-the-fold content, defer the rest, and set font-display: swap so text paints in a fallback font instead of waiting.
For JavaScript-rendered pages, server-side rendering moves the LCP element into the initial HTML instead of making the browser build it. That's a bigger change than the others, but it's the one that matters most for app-shell sites — and our data suggests it's underused. Content that appears in the rendered DOM but is absent from the raw HTML shows up on 31.4% of the sites we audit, and B2B SaaS is the worst-hit vertical, with 64% failing mobile LCP. If that's your stack, our guide to technical SEO for SaaS goes deeper.
⚠️Common Mistake: Lazy-loading the hero image because a plugin offered to lazy-load "all images". You've just guaranteed the browser waits for JavaScript before it starts fetching the one element LCP is timing.
How do you fix a failed INP?
INP measures responsiveness: you tap, and INP counts the milliseconds until the browser paints the next frame showing something happened. A failing INP means the main thread was too busy to respond.
Almost every INP problem is a long task — a chunk of JavaScript that hogs the main thread for more than 50 ms, during which the browser cannot respond to anything. The fixes all amount to the same idea: do less work on the main thread, or do it in smaller pieces.
Break up long tasks. Split heavy work into chunks and yield to the browser between them so it can service pending interactions. Google's guide to optimizing long tasks covers the scheduler.yield() and setTimeout patterns for this.
Ship less JavaScript. Code-split with dynamic imports so a route only loads what it needs. Audit your bundle for libraries pulled in whole for one function.
Audit third-party scripts, hard. Chat widgets, A/B testing tools, tag managers and ad scripts run on your main thread and are the usual suspects for both INP and unexpected layout shifts. Remove what you can't justify, and load the rest with async or defer:
<script async src="script.js"></script>
<script defer src="script.js"></script>
async lets the browser keep building the DOM while the script downloads, then pauses DOM construction to execute it. defer never pauses — the script runs only once the DOM is fully built. For third-party tags that aren't needed for first paint, defer is almost always the safer choice.
Move heavy computation off the main thread with a Web Worker, so long-running work can't block interaction.
Optimize the event handlers themselves. A handler that triggers a large DOM update or forces a synchronous layout recalculation will blow your INP budget on its own. Update what changed, not the whole component.
Google's INP optimization guide is the reference to work through once you've found which interaction is slow. And a note on measurement: INP needs a real interaction to exist. Lighthouse can't produce an INP score, so lab tools will only ever show you potential problems — the real number comes from field data.
💡Quick Insight: INP fails on 29.6% of the sites we audit versus 58.4% for mobile LCP — but INP failures are concentrated in JavaScript-heavy sites. If you run a SPA, a page builder, or a stack of marketing tags, reverse the usual priority and check INP first.
How do you fix a failed CLS?
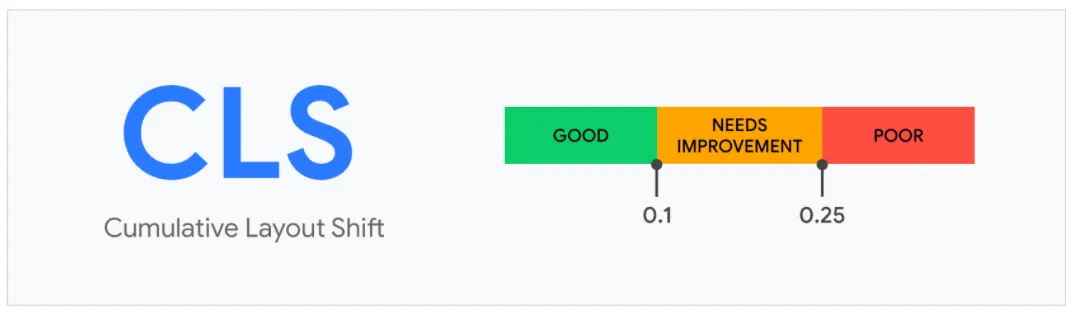
CLS measures visual stability — content jumping around while the page loads. It's the metric with the smallest number of causes and the cheapest fixes.
Reserve space for everything that loads late. Set explicit width and height attributes (or a CSS aspect-ratio) on every image, video, iframe and ad slot. The browser then reserves the right box before the file arrives, instead of reflowing the page around it.
<img src="product.avif" width="500" height="600" alt="Product photo">
<iframe src="video.html" width="900" height="800"></iframe>
Never insert content above existing content unless it's responding to a deliberate user action. Cookie banners, promo bars and "you have 1 new message" strips that appear after paint push everything down and rack up shift score.
Give webfonts a stable fallback. A font swap that changes text metrics reflows the paragraph around it. Pair font-display: swap with a fallback whose metrics are close to the webfont's, and preload the font files you need above the fold.
Animate only transform and opacity. These are composited by the GPU and don't trigger layout. Animating width, height, top or margin reflows the page on every frame. CSS contain: layout is worth knowing about too — it isolates an element's layout from the rest of the document.
Google's CLS optimization guide covers the debugging workflow for tracking down which element is doing the shifting.
What should WordPress users do differently?
WordPress sites fail Core Web Vitals for a predictable set of reasons, and they're fixable without touching much code.
- Add page caching, then a CDN. This is the single biggest TTFB lever on shared hosting. WP Rocket and W3 Total Cache both handle caching, minification and deferred loading. Set them up carefully — aggressive "optimize everything" presets are a common cause of new CLS and INP problems.
- Convert images to WebP or AVIF and set dimensions. Most themes output images without
width/height, which is free CLS.
- Exclude the hero from lazy-loading. Every optimization plugin lazy-loads images by default. Every one of them will tank your LCP unless you exclude the above-the-fold image explicitly.
- Count your plugins honestly. Each one can add its own CSS and JavaScript to every page. Plugin sprawl is the usual root cause of WordPress INP failures.
- Pick a light theme. Multi-purpose themes bundled with page builders ship far more code than most sites use.
- Upgrade hosting before you micro-optimize. If TTFB is 1.2 s on a $4/month plan, no plugin will save you.
🚩Red Flag: Stacking two optimization plugins. Overlapping minification and deferral rules break each other in ways that are genuinely hard to debug — and often make INP worse than the unoptimized baseline. Pick one.
How long until the assessment flips to "Passed"?
Deploy your fix and nothing happens. That's expected, and it's the point where most people give up.
CrUX reports a rolling 28-day window. The day after you ship, 27 of those 28 days still contain the old, slow experience. The 75th percentile barely moves. You need to wait out the window.
A realistic timeline:
| When | What you'll see |
|---|
| Immediately | Lab tools (Lighthouse, our speed test) reflect the fix |
| ~7 days | Field data starts trending in the right direction |
| ~28 days | The window has fully turned over — this is your real verdict |
| 28+ days | Search Console group status updates to Passed |
In Search Console you can click Start tracking on a failing issue, which asks Google to monitor the fix. It runs for 28 days and moves through Started → Looking Good → Passed. Note that starting validation doesn't trigger re-indexing or speed anything up; it just watches.
Two things to check while you wait, because they're the reason a genuinely fixed site stays red:
- Did the fix reach production? Staging-only fixes are common and invisible to CrUX.
- Did you fix the whole URL group, or one page in it? Group status is decided by the group's aggregate, not your test URL.
📌Pro Tip: Ship your fixes in a batch rather than one a week. Every deploy restarts the clock on a clean 28-day read, and drip-feeding changes makes it impossible to tell which one worked.
How do you stop it failing again?
Passing once is easier than staying passed. Performance decays — a new tag here, a bigger hero there, a redesign that quietly doubles the bundle.
Set a performance budget. Pick limits and treat breaching them as a build failure, not a suggestion:
- Choose the metrics that matter for your site. A content site lives on LCP; an interactive app lives on INP.
- Baseline from field data, not lab data. Your current 75th percentile in CrUX is the honest starting point.
- Set thresholds with headroom. Budget LCP at 2.0 s rather than 2.5 s, so normal drift doesn't immediately fail you.
- Enforce in CI. Lighthouse CI can fail a pull request that breaches the budget — far cheaper than finding out 28 days after release.
- Revisit quarterly as the site changes.
Watch for regressions after the events that cause them: redesigns, new marketing tags, a plugin update, a hosting migration. Those four account for most of the "we were passing last month" cases. Running a scheduled crawl catches template-level regressions before CrUX does — our SEO crawler renders JavaScript the way Googlebot does, so it sees what a raw-HTML fetch misses.
Does failing Core Web Vitals actually hurt rankings?
Yes, but less dramatically than most posts imply, and being honest about that is worth more than the scare copy.
Core Web Vitals are a real ranking input. Google's Search documentation puts it plainly: site owners should "achieve good Core Web Vitals for success with Search," and this "aligns with what our core ranking systems seek to reward."
What it is not: a penalty. A failed assessment doesn't remove you from the index or apply a manual action. Relevance and content quality still outweigh speed — a slow page that answers the question will usually beat a fast page that doesn't. Where Core Web Vitals decides outcomes is between pages of similar quality, which in a competitive SERP is most of them.
The commercial case is usually stronger than the ranking case anyway. Slow, jumpy pages lose people before they convert, and that shows up in revenue faster than it shows up in rankings. Our post on how load speed affects SEO covers that relationship in more detail, and the technical SEO issues we see most often puts performance in context against the rest of the audit.
Frequently asked questions
Why did my Core Web Vitals assessment fail?
Because fewer than 75% of your real visitors got a "good" result on at least one of LCP, INP, or CLS during the last 28 days. The most likely culprit is mobile LCP — it's the most-failed rule across the 100,000+ sites we audit, at 58.4%. Check PageSpeed Insights' field data section on the Mobile tab to see which specific metric is amber or red.
How do I pass the Core Web Vitals assessment?
Get all three metrics under their thresholds — LCP ≤ 2.5 s, INP ≤ 200 ms, CLS ≤ 0.1 — for at least 75% of real visits on the device type that's failing. In practice: identify the failing metric, fix it at the template level rather than on one URL, deploy to production, then wait 28 days for CrUX's rolling window to turn over.
What is a good Core Web Vitals score?
There's no single score. Each metric has its own bar: LCP under 2.5 seconds, INP under 200 milliseconds, CLS under 0.1. The 0–100 number PageSpeed Insights shows is the Lighthouse performance score, which is a lab simulation and plays no part in the pass/fail assessment.
Why does PageSpeed Insights show a high score but the assessment still fails?
You're reading two different measurements. The 0–100 score is lab data from a single simulated load on your test conditions. The assessment is field data from real Chrome users over 28 days, at the 75th percentile — slower devices, worse networks, cold caches. Lab data helps you debug; only field data decides Passed or Failed.
No. INP replaced FID on 12 March 2024, and FID was removed from Google's tooling by 9 September 2024. If a guide or plugin still targets "FID under 100 ms", its responsiveness advice is aimed at a metric Google stopped measuring. INP is stricter: it grades every interaction, not just the first one.
How long does it take to pass after I fix the problem?
Around 28 days, because CrUX reports a rolling 28-day window and each day after your fix replaces only one day of old data. Lab tools show the improvement immediately, field data starts trending within about a week, and the full verdict lands once the window has turned over.
Does a failed Core Web Vitals assessment hurt my rankings?
It's a genuine ranking input, not a penalty. You won't be deindexed or manually actioned. Relevance still dominates, so a slow page with the best answer often outranks a fast page with a worse one — but between comparable pages, Core Web Vitals can decide the order. The conversion cost of a slow page usually exceeds the ranking cost.
What does "no data" mean in the Core Web Vitals report?
Your page doesn't have enough Chrome visitors for Google to report on it without compromising privacy. You're not failing — there's just nothing to grade. Search Console will often fall back to origin-level data covering the whole domain instead. Use lab tools and the origin trend to guide fixes until the page has traffic.
Why did fixing one page not change my Search Console status?
Search Console groups URLs with a similar experience — typically by template — and grades the group, not your single URL. Fixing one page inside a group of 400 barely moves the group's 75th percentile. Fix the template, and every URL in the group improves at once.
Can I check Core Web Vitals without Search Console?
Yes. PageSpeed Insights shows the same CrUX field data for any public URL, including your competitors', with no account needed. Our free website speed test covers the lab side, and a full SEO audit puts performance alongside the other technical checks that affect the same pages.
Where to start
If you take one thing from this: diagnose before you optimize. Name the metric, name the device, name the template. Most wasted performance work comes from skipping those three answers and going straight to whatever the last blog post recommended.
Then work in this order — identify the failing metric in field data, fix it at the template level, ship to production, and give CrUX its 28 days before you judge whether it worked. If your failure is mobile LCP, as it is for most sites we audit, start with server response time and the hero image before you touch a line of JavaScript.
Run the free SEO audit tool to see which performance rules your site is failing and how that compares to the 100,000+ sites in our data.
Source: SEOmator audit-engine data, January–July 2026 (100,000+ websites audited, 50M+ pages crawled with our 251-rule audit engine). Figures describe the sites in our panel, which skews toward B2B SaaS.