

· 8 min read
The Role of User Experience in SEO: Statistics and Best Practices
Learn how user experience (UX) influences SEO rankings, with key statistics and actionable best practices to improve site performance and engagement.
AI Overviews now appear on 27.4% of the keywords we track, and 91.3% of their citations came from the organic top 20. See what SEO and PPC each buy in 2026.

Isabella Edwards · Technical SEO Content Manager, SEOmator
Leads technical SEO content at SEOmator: audits, Core Web Vitals and on-page fixes
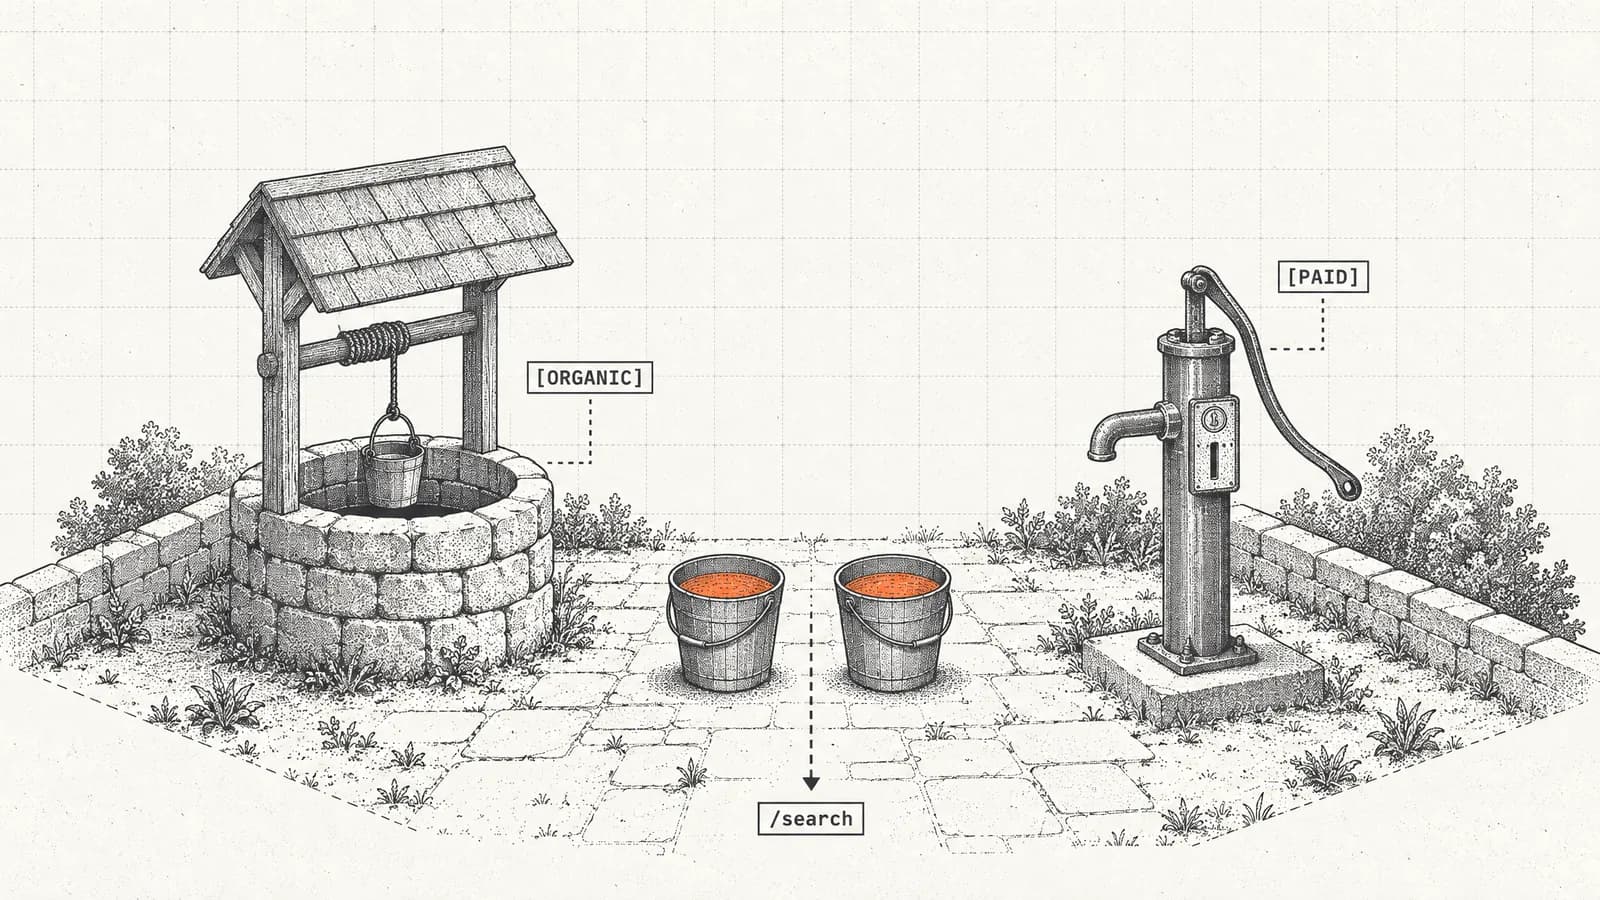
The 2026 SEO vs PPC statistics split along one line: the organic investment buys clicks and eligibility to be cited, while the paid investment buys clicks only. Across the keywords we track, AI Overviews appear on 27.4% of SERPs (July 1–21, 2026), and 91.3% of the citations inside them went to pages already ranking in the organic top 20.
Key findings
- AI Overviews appear on 27.4% of the keywords we track (July 1–21, 2026), up from 18.9% in January.
- 91.3% of the AI Overview citations we logged in the first half of 2026 came from pages already in the organic top 20.
- AI engines sent about 1.2% of all sessions across the sites we track in July 2026, against 0.62% in January.
- Google returns roughly one visit per 4.7 page fetches; Mistral takes about 24,543 fetches per referral (Cloudflare Radar, 28 days to July 30, 2026).
- Paid search averages $5.42 per click and an 8.18% conversion rate across 13,000+ US campaigns (WordStream, April 2025 to March 2026).
- Organic converts at 2.4% against paid at 1.3% in First Page Sage's client data — and six other sources publish six different numbers.
The results page grew a third column. This comparison used to put organic clicks on one side and paid clicks on the other; in 2026 there is an answer layer above both, and it moves the math measurably.
Three dated numbers from our own network make the case. AI Overviews now appear on 27.4% of the keywords we track (July 1–21, 2026), up from 18.9% in January — around 34% on SaaS and comparison queries, closer to 19% on e-commerce product queries. Our panel leans B2B, so that is our keyword mix, not a universal rate. Second, 91.3% of the AI Overview citations we logged in the first half of 2026 went to pages already ranking in the organic top 20. Third, AI engines still sent only about 1.2% of all sessions across the sites we track in July 2026.
Together they say something narrower than "SEO is cheaper long-term". A share of organic impressions no longer becomes a click, because the answer sits above the link — but the only route into that answer is ranking, and ranking is bought with content, links and technical work rather than with a bid.
The first thing I check before splitting a budget is how much of the target keyword set already carries an AI Overview, because that changes the value of a rank-3 position more than any blended industry average will. You can check which of your keywords trigger AI Overviews first, and our AI SEO statistics roundup has the wider trend lines.
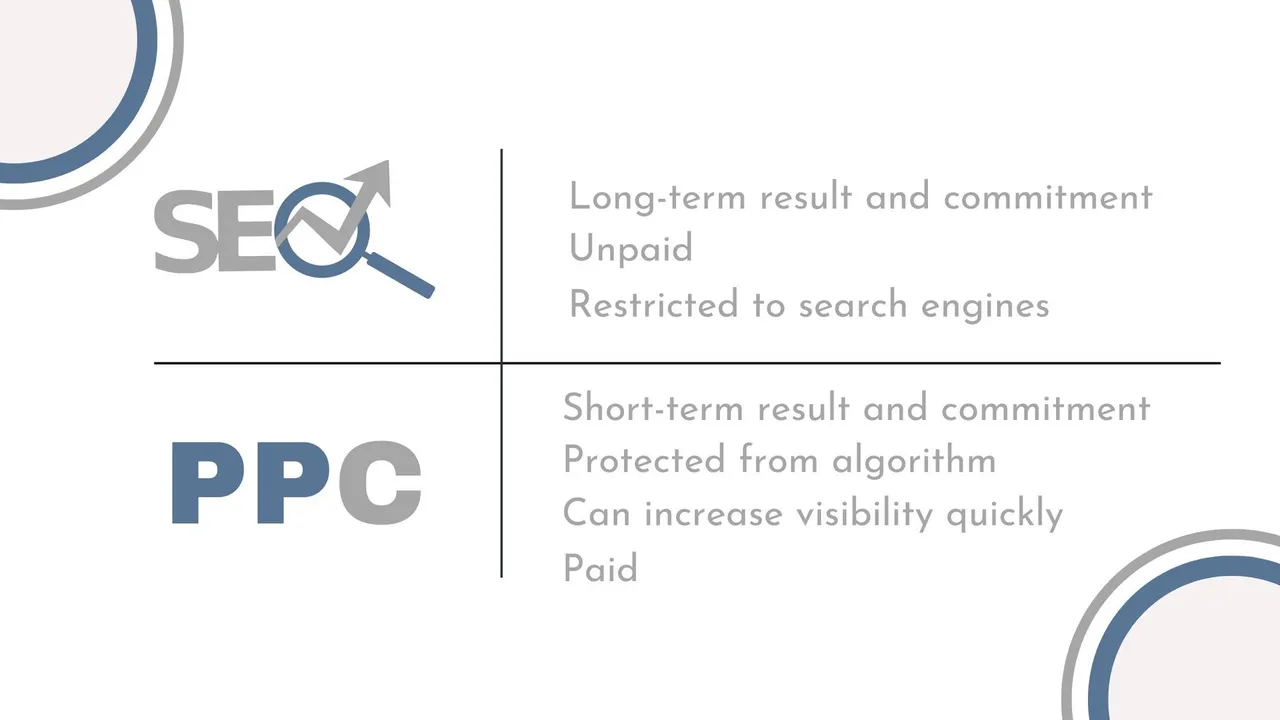
Both channels still do the same underlying job. SEO and PPC are the most effective tactics to increase website visibility through SERPS. Both methods are highly effective in driving traffic to websites and generating leads. SEO is a long-term strategy that involves optimizing a website's content, structure, and code to rank higher in organic search results — how SEO works covers the mechanics. PPC is a short-term strategy that involves bidding on keywords to have ads appear at the top of search results pages.
Let's look at the statistical findings that might benefit you!
When you optimize your website for relevant keywords and search terms, you increase your chances of appearing at the top of search engine results pages (SERPs). This can lead to increased organic traffic and exposure for your website.
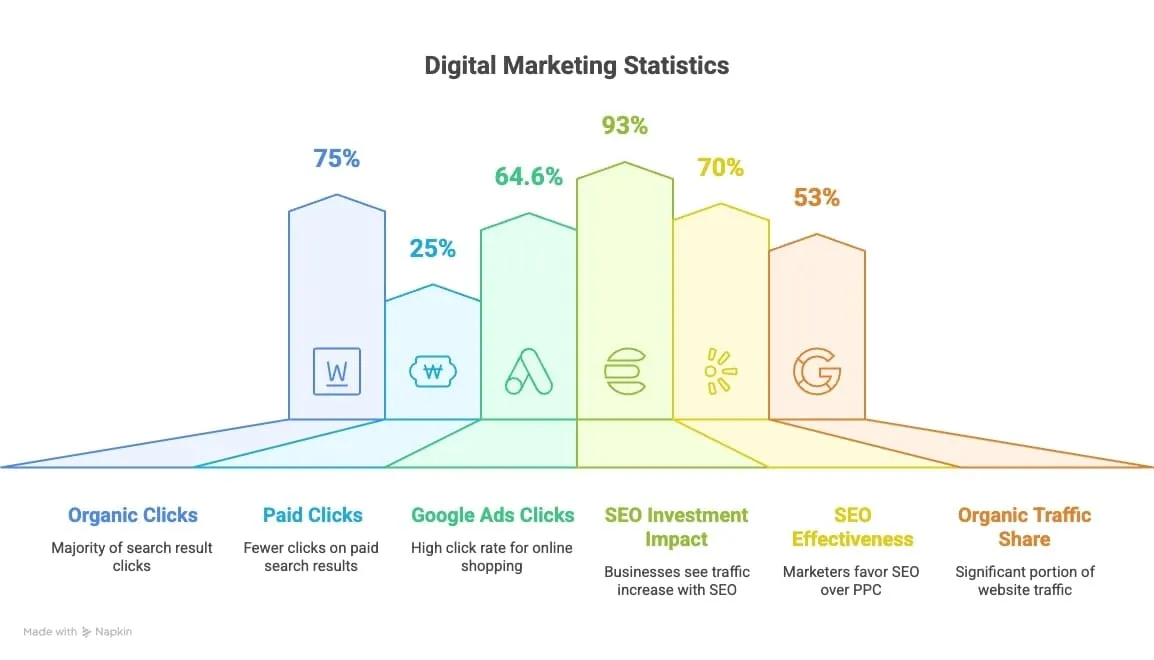
Organic clicks are free and occur when users click on a website link that appears in the unpaid portion of the SERPs.
Paid clicks occur when users click on a website link that appears in the paid portion of the SERPs.
Paid clicks are typically more expensive than organic clicks but can lead to more immediate results.
Here is a table that summarizes the key differences between organic clicks and paid clicks. Two rows carry a caveat rather than a verdict: CTR and conversion rate depend on query intent and on how the figure was measured, so those cells state the basis.
| Feature | Organic clicks | Paid clicks |
|---|---|---|
| Cost | No charge per click; cost sits in content, technical work and links | Charged per click, $5.42 on WordStream's 2025–26 average |
| Location | Unpaid portion of the SERPs, below ads and any AI Overview | Paid portion, above the organic block |
| Share of search clicks | Roughly 75% | Roughly 25% |
| Click-through rate | Highest single CTR on the page at position 1, falls steeply by rank | Beats a mid-page organic result on commercial intent, loses on informational queries |
| Conversion rate | 2.4% all-industry in First Page Sage's client data | 1.3% in that dataset, 8.18% in WordStream's campaign data — different denominators |
| Time to first result | Months | Same day |
| When spend stops | Rankings persist, then decay | Traffic stops immediately |
| AI Overview citation | Eligible; 91.3% of citations we logged came from the top 20 | Not eligible; ads are not cited |
The best click type for your website will depend on your specific goals and budget.
Ultimately, the best way to determine which type of click is best for your website is to experiment and see what works best for you.
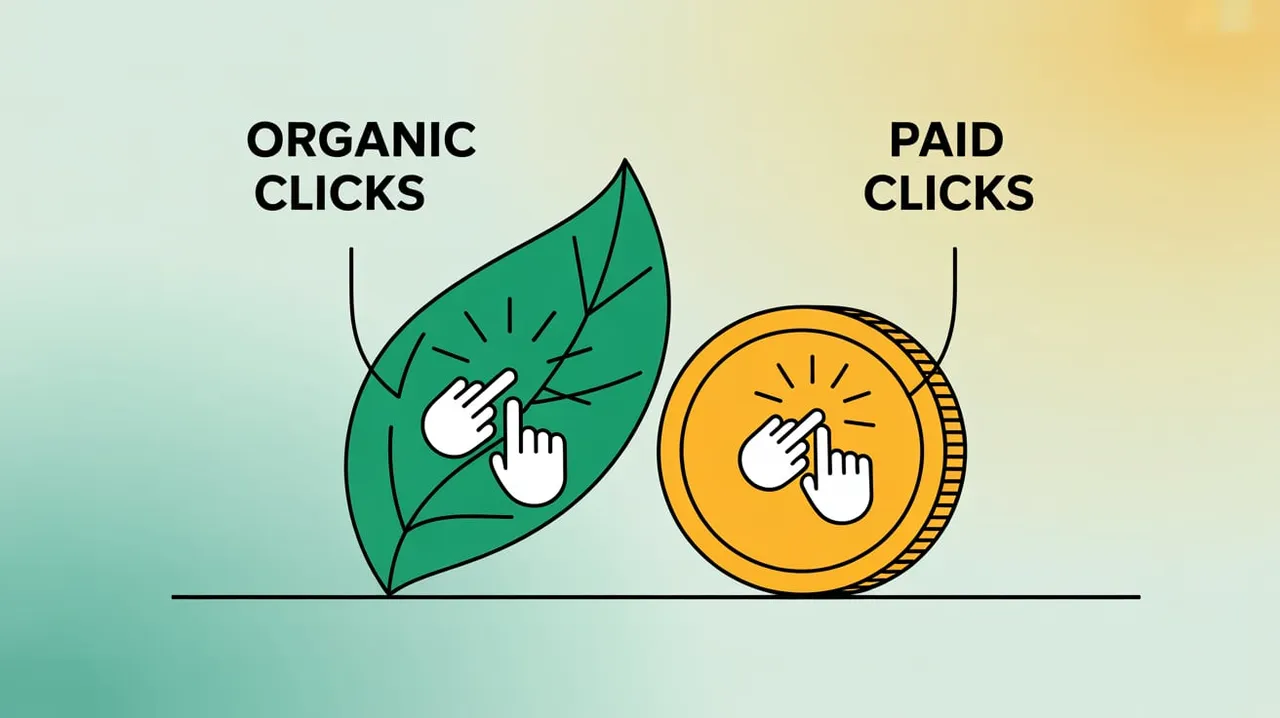
According to a study by WordStream, 75% of clicks on search results pages are for organic results, while only 25% are for paid results. This means that organic results are much more likely to be clicked on than paid results. Read it as a durable directional split rather than a 2026 measurement: it predates AI Overviews, and where one appears the first screen has less room for both.
Organic search drives a substantial portion of overall website traffic, accounting for approximately 53% of the total traffic received.
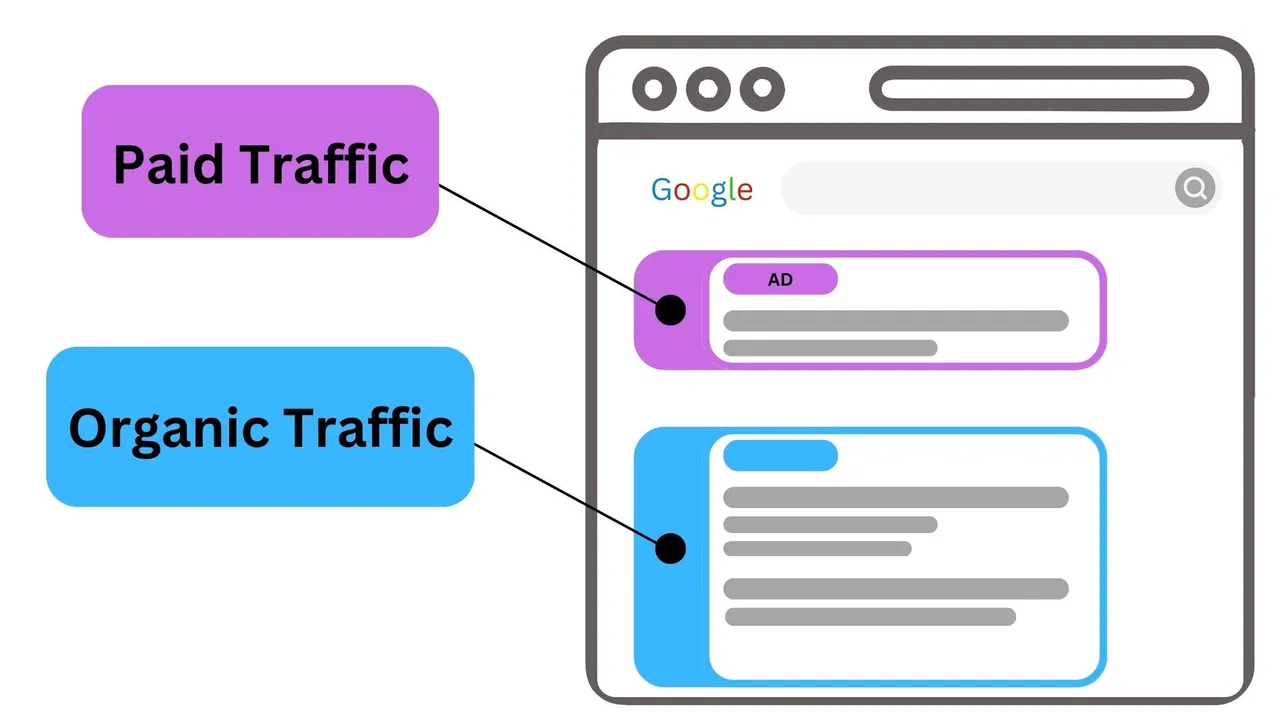
This indicates the significant role organic traffic plays in driving website visitors without relying on paid advertising or promotions. If you don't yet know what share of your own visitors arrive this way, a free organic traffic checker will give you the baseline before you weigh a PPC budget against it.
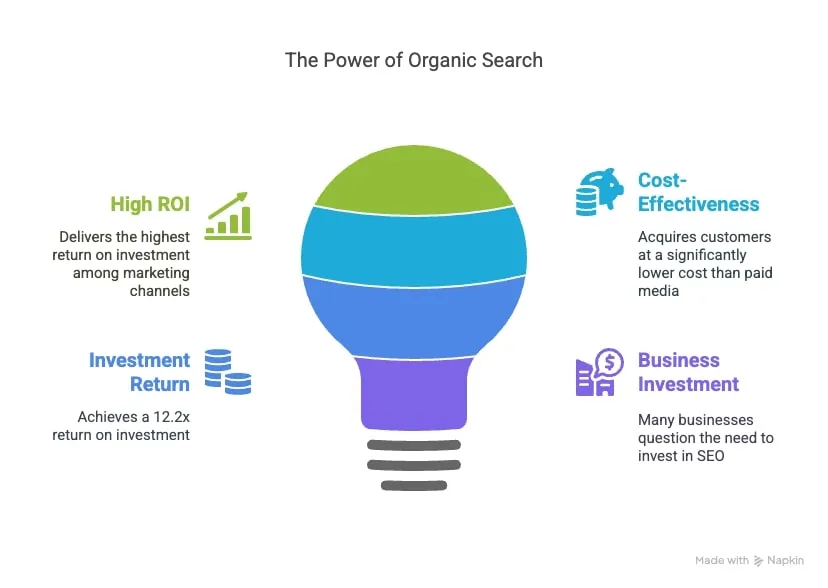
According to Search Engine Journal, nearly half of all marketers (49%) consider organic search to deliver the highest return on investment (ROI) among all marketing channels.
This means that businesses can make a significant profit by investing in SEO.
A study by Terakeet found that businesses can acquire customers for 87.41% less on average using organic channels than paid media.
Additionally, businesses can achieve a 12.2x ROI on their investment in organic channels.
Many business owners invest heavily in Google Ads, as they should, but they often question the need to invest in SEO.
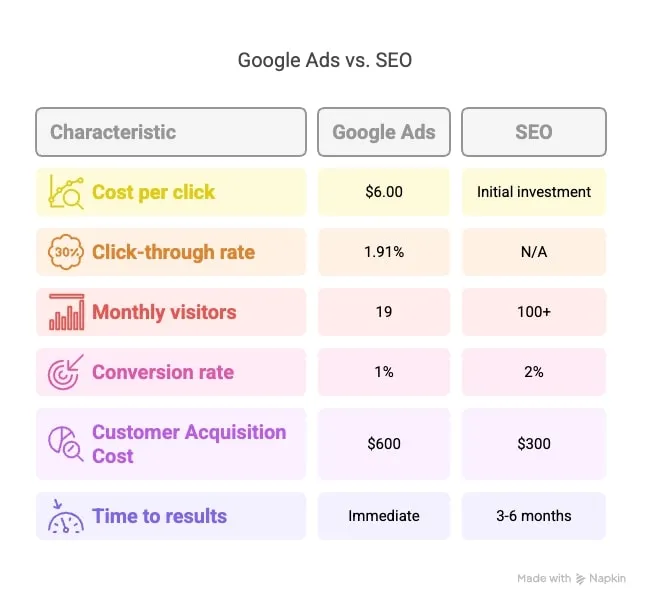
Businesses need to spend an average of $5.42 for every click they receive on their paid ads, and that auction keeps getting more expensive.
Investing in SEO can yield substantial returns in comparison to the cost of paid ads, making it a highly worthwhile investment for businesses.
While Google Ads can be effective, it's worth pricing the long-term costs and benefits of both strategies. Here's a comparison of customer acquisition through Google Ads versus SEO on the same $1,000 monthly budget. Every input is a published benchmark or a stated assumption — an illustration, not a forecast.
Google Ads
As you can see, Google Ads can be an expensive way to acquire customers, and the figure is sensitive to one assumption: at a 10% lead-to-customer rate the same budget produces a CAC near $665.
SEO
Paid hands you a number in week one and it stays flat. Organic gives you none for two quarters, then a declining one.
Pay-per-click (PPC) advertising is a type of online advertising where businesses pay a fee each time someone clicks on their ad.
PPC ads are displayed at the top of search engine results pages (SERPs) when someone searches for a keyword or phrase that the business has targeted.
Average return on ad spend across industries sits near 200%, per Digital Applied's 2026 roundup, which also puts global PPC spend on track for roughly $306 billion in 2026, up about 11% year over year.
This means that for every $1 a business spends on PPC advertising, they generate $2 in revenue — at the average, across accounts that survived long enough to be measured.
HubSpot cites a study by WordStream that found that the average click-through rate (CTR) for PPC ads is just 2.3%. This means that for every 100 people who see a PPC ad, only 2.3 will click on it. WordStream's current benchmarks put search CTR at 6.64%, so read 2.3% as an older aggregate that mixed display with search inventory.
The study also found that the CTR for PPC ads can vary depending on a number of factors, including the industry, the keywords, and the time of year.
For example, the CTR for ads for travel and tourism businesses is typically higher than the CTR for ads for B2B businesses.
In a search advertising benchmarks report by WordStream, several industries were identified to have the highest average costs per click in Google Ads.
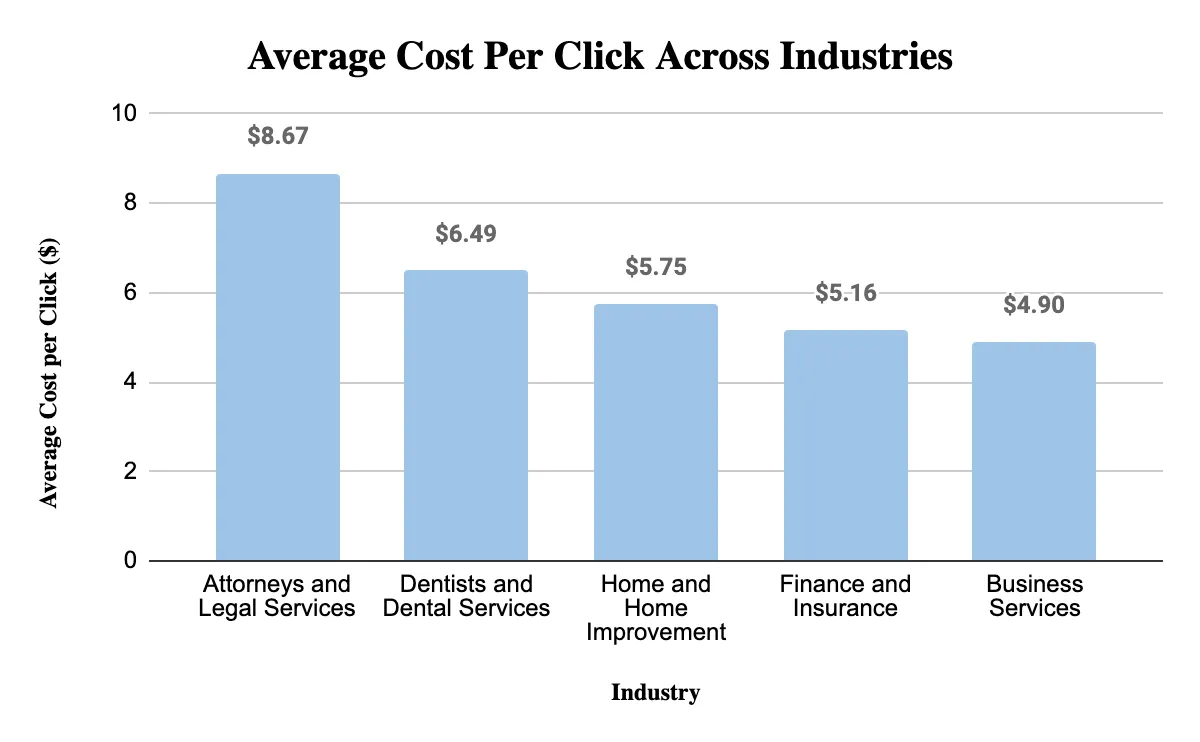
These industries include;
Take those five as the ranking of the expensive verticals rather than as this month's prices; the order has been stable for years, the absolute figures have drifted upward since the benchmark period.
Additionally, the report also highlighted industries with the highest average cost per lead, which is the cost incurred for each potential customer acquired.
Attorneys and legal services topped the list with an average cost per lead of $73.70, followed by furniture at $64.72, finance and insurance at $62.80, business services at $62.18, and career and employment at $53.52.
These findings are significant as they shed light on the industries that invest the most in Google Ads. While big brands in the insurance and legal sectors can spend millions of dollars per year on Google Ads, success with Google Ads doesn't necessarily require such massive budgets. The costliest verticals are also where an organic programme repays fastest — our B2B content marketing statistics breakdown covers what that programme consists of in business services.
With effective campaign management and optimization, businesses can achieve positive results and drive meaningful outcomes without the need for exorbitant advertising budgets.
The click-through rates (CTR) on different social media platforms vary significantly.
However, Facebook offers various ad formats, and the CTRs can differ based on the specific goals of the ads.
This can be attributed to the visual nature of Instagram, where organic newsfeeds have limited opportunities for click-throughs, except for Stories. In comparison, Instagram Stories have a slightly higher CTR of 0.33%.
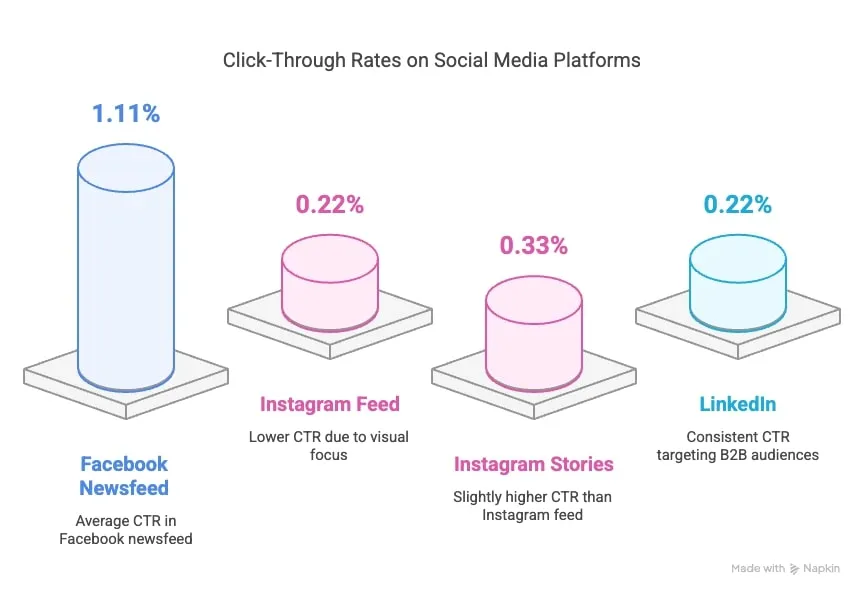
Targeted ads have higher CTRs.
Against paid search's 6.64% average CTR, every social placement above is an order of magnitude lower, which is the arithmetic behind search taking the larger share of most performance budgets.
Instagram is a great platform for reaching a younger audience.
Instagram has over 928.5 million active users, and nearly two-thirds of them are between the ages of 13 and 34.
Social media advertising is a growing market.
US brands are expected to spend over $56 billion on social media advertising. The majority of this spending will go to Facebook, which accounts for 80% of the social media advertising market.
Most brands are satisfied with the PPC market.
84% of brands being satisfied with the PPC market shows us that pay-per-click has been an effective way for businesses to look for targeted audiences and generate leads or sales.
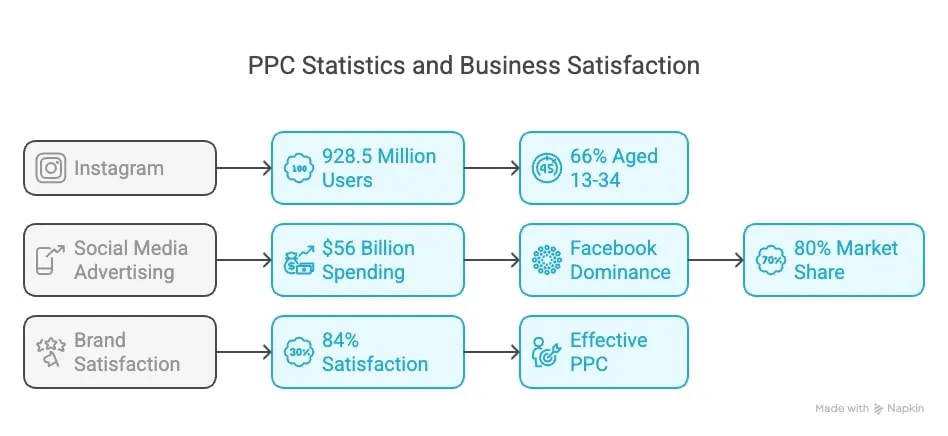
Commercial-intent terms carry both the highest CPCs and the highest conversion rates. Screen the same list organically while you bid on it: a keyword you can rank for is a keyword you eventually stop paying for.
Create compelling ad copy. Your ad copy should be clear, concise, and persuasive. It should also be relevant to the keywords you're targeting.
Set a budget and track your results. It's important to set a budget for your PPC campaigns and track your results. This will help you determine which campaigns are working and which ones need to be adjusted. WordStream's $66.69 average cost per lead is the number to beat.
Do not fall into despair, because just a mere 5% of newly created pages manage to secure a spot within the top 10 positions in search engine rankings within the first year, according to HigherVisibility. That is the best argument for running paid while organic matures rather than choosing between them.
Averages hide the thing that matters, which is how far the organic-versus-paid gap swings by sector. First Page Sage publishes the deepest breakdown, drawn from its own client base, and it is the closest this topic gets to like-for-like: one agency, one definition, both channels.
| Industry | Average SEO conversion rate | Average PPC conversion rate |
|---|---|---|
| All industries | 2.4% | 1.3% |
| Legal services | 4.4% | 2.2% |
| HVAC services | 3.3% | 1.8% |
| Financial services | 2.2% | 0.3% |
| B2B SaaS | 2.1% | 1.0% |
Source: First Page Sage's proprietary client dataset — an agency's own book of business, skewed toward B2B lead generation, with a conversion defined on their terms. A limitation, not a disqualification: it is one consistent yardstick applied to both channels.
The same firm publishes return on ad spend and break-even timing, which is the more decision-relevant table:
| Industry | SEO return on ad spend | Time to break even |
|---|---|---|
| Financial services | 11.10 | 9 months |
| B2B SaaS | 8.75 | 7 months |
| eCommerce | 3.65 | 9 months |
Source: First Page Sage SEO ROI report.
ROI tables also skip the starting line. The median site we audit scores 71 out of 100, a C+, and only about 6.8% earn an A, so at the median part of the first quarter's budget goes on fixing what is already broken. Our 100K+ site audits breakdown has the distribution, and you can run a site audit to place yourself in it before modelling a payback period.
Because almost none of them measure the same thing, and most are published by firms selling one of the two services. I went through 66 published figures on SEO versus PPC performance while assembling this post, and they disagree by an order of magnitude — one source disagrees with itself on the same page. Sorting out which of them can carry a budget decision is the part these roundups usually skip.
| Metric | Reported figure | Source |
|---|---|---|
| SEO conversion rate | 2.4% (all industries) | First Page Sage |
| SEO conversion rate | 14.6% | Click Vision |
| PPC conversion rate | 1.3% | First Page Sage |
| PPC conversion rate | 3.75% | Visionary Marketing |
| PPC conversion rate | 7.52% in the 2025 edition, 8.18% in the 2026 edition | WordStream (same page, consecutive annual samples) |
| PPC conversion rate | 10% | Click Vision |
| Relative conversion | "PPC converts about 50% better than SEO" | Coupler.io |
| SEO ROI | 748% | Outpace SEO |
| SEO ROI | 12.2x | Terakeet |
| Position-1 organic CTR | 37.15% | Click Vision |
| Position-1 organic CTR | 27.6% | Visionary Marketing |
SagaPixel is the clearest illustration: one page states both that "SEO advertising converts at a rate of 2.4%, nearly double that of PPC, which converts at 1.3%" and that "visitors from PPC ads are 35% more likely to convert than those from SEO." Both sentences cannot describe the same population.
Four things produce the spread, and naming them makes the numbers useful again:
The honest rule: treat these as ranges and directional signals, never as forecasts. "Organic tends to convert better than paid on the same term, in the same account, measured the same way" survives all 66 figures. "SEO converts at 14.6%" does not survive contact with your own analytics.
One visit per 4.7 page fetches, if the crawler is Google. That ratio is the cleanest measure of what an organic investment returns, and it separates search engines from answer engines. Cloudflare Radar publishes it globally; we track the same metric across the sites we monitor, so the two can sit side by side.
| Operator | SEOmator panel (Jul 1–21, 2026) | Cloudflare Radar (28 days to Jul 30, 2026) |
|---|---|---|
| Mistral | 6,021 : 1 | 24,543 : 1 |
| Anthropic | 2,363 : 1 | 1,895 : 1 |
| Perplexity | 263 : 1 | 273 : 1 |
| OpenAI | 179 : 1 | 228 : 1 |
| Microsoft | 35.4 : 1 | 36.4 : 1 |
| 4.0 : 1 | 4.7 : 1 | |
| DuckDuckGo | 2.7 : 1 | 2.5 : 1 |
Read each column as fetches per referral, not as a percentage. The two independent measurements agree within a few percent on six of the ten operators compared: Perplexity 273 against 263, Microsoft 36.4 against 35.4, Yandex 26.9 against 25.5, Baidu 12.1 against 11.7, ByteDance 9.7 against 10.1, DuckDuckGo 2.5 against 2.7. The windows differ — ours covers July 1-21, 2026, Radar's the 28 days ending July 30 — and Mistral is the outlier at roughly 4x, so lean on its direction rather than its level.
The trend is steep: Anthropic's crawl-to-referral ratio fell from roughly 57,000:1 in January to about 2,400:1 by July 2026 across the sites we track, and OpenAI's from about 1,264:1 to 179:1. Both improved quickly and both remain orders of magnitude from search. Our crawl-to-refer ratio analysis has the per-operator detail, and AI bot traffic by country has the user-agent breakdown.
None of this argues for cutting a channel. It argues for one accounting change: extraction at 200:1 or 2,000:1 is a cost your organic programme already absorbs, and citation eligibility is what you get back for it. Paid search neither pays that cost nor collects that return.
Yes, and the split is worth checking against your own data rather than a public benchmark. Cloudflare Radar's global HTTP data shows 60.7% desktop and 39.2% mobile over the 28 days ending July 30, 2026, essentially flat against the preceding 28 days at 60.2% and 39.7%. That is a share of requests on Cloudflare's network, not of sessions. Across the sites we track, desktop accounted for 69.2% of sessions in June 2026 — nine points more desktop than the global request figure. Both are defensible: they count different things on different populations, and our panel is B2B-heavy.
For a budget split the consequence is screen space. A mobile results page fits fewer results above the fold, so ads and any AI Overview push the first organic link further down on the device where scrolling costs most. If your traffic is mobile-heavy and your keywords carry AI Overviews, the organic click you are modelling is worth less than its desktop equivalent at the same rank, and the top paid slot is worth relatively more.
Almost every account should, and not to cover all bases. Each channel produces something the other needs: paid search generates fast, clean keyword and conversion data, the cheapest way to learn which terms deserve a six-month organic programme, while organic rankings build the page relevance that improves ad quality signals on the same terms. Once a paid term proves it converts, our keyword research tool will show what ranking for it organically would take.
The one place the budgets genuinely collide is brand terms. Bidding on your own name buys clicks you would probably have had for free, and the answer depends on whether competitors are bidding against you — our branded vs non-branded keywords breakdown covers how to split that reporting. Business stage decides the ratio more than industry does: a company with no rankings should be paid-heavy, and one with an established page inventory is leaving money on the table if it is not organic-heavy.
When deciding between SEO and PPC, it is important to consider the goals of the business. If the goal is to build a strong online presence and generate long-term ROI, then SEO may be the better choice.
The strategic objective of SEO is to optimize a website to attract the right kind of organic traffic and sustainably improve its SERP ranking. PPC, on the other hand, is better suited for short-term campaigns focused on specific products or services, where a more immediate ROI is needed.
What changed is the tie-breaker. The organic investment now buys clicks and eligibility to be cited in the answer layer above those clicks; the paid investment buys clicks. On the 27.4% of tracked keywords carrying an AI Overview, no bid purchases the second one.
Choose wisely according to what your business needs! If you are a newly formed startup, we recommend you start with PPC while slowly building your SEO presence.
However, if you are not new to the game then it may be better for your business to invest in SEO, such as blogging. Our blogging statistics roundup covers what that investment returns.
First-party figures come from SEOmator crawling and analytics data, January to July 2026: 100K+ websites audited, 50M+ pages crawled, 50M+ users tracked monthly across 500+ analytics-installed sites, and 1M+ keywords and prompts tracked monthly. The panel is roughly 60% B2B SaaS, 20% e-commerce and 20% mixed, so these figures describe the business web rather than the consumer internet. July 2026 is partial, covering July 1-21.
Source: Cloudflare Radar — radar/bots/crawlers/summary/crawl_refer_ratio and radar/http/summary/device_type (radar.cloudflare.com), 28 days ending July 30, 2026. Radar's crawl-to-refer figure is fetches per referral, not a percentage, and its device split is a share of requests rather than of sessions.
External SEO vs PPC statistics are attributed inline. Two carry stated methodology and do most of the work: WordStream's 2026 search advertising benchmarks (13,000+ US campaigns, April 2025 to March 2026) and First Page Sage's client dataset. The rest are agency aggregates without disclosed samples or windows, presented as ranges rather than measurements.
SEO (Search Engine Optimization) is the practice of optimizing a website to improve its visibility and organic rankings in search engine results. PPC (Pay-Per-Click) is a paid advertising model where advertisers pay for each click on their ads displayed on search engine results pages. The 2026 addition: organic rankings are the entry requirement for AI Overview citations, and paid placements are never cited.
Roughly 75% of clicks on a results page go to organic and about 25% to paid, a split that has held directionally for over a decade. Two caveats now apply: the ratio tightens on high commercial-intent queries where ads take more of the first screen, and on the 27.4% of keywords we track that carry an AI Overview, some impressions produce no click for either side.
According to statistics, 70% of marketers consider SEO to be more effective than PPC in driving long-term results and generating organic traffic. However, the effectiveness may vary depending on the specific goals and circumstances of each business. Opinion surveys are also the weakest evidence type here — they measure sentiment, not outcomes.
Neither, for a specific reason. Paid buys clicks at a knowable cost of about $5.42 each. Organic buys clicks plus eligibility for citation: 91.3% of the AI Overview citations we logged in the first half of 2026 came from the organic top 20. Few AI Overviews on your keyword set and pipeline needed this quarter, and paid wins on merit. Many AI Overviews and two quarters of runway, and only organic competes there.
The average CPC for paid search is $5.42, from WordStream's analysis of over 13,000 US campaigns running April 2025 through March 2026. Cost varies widely by industry: legal services average $8.67 per click, dentists $6.49, home improvement $5.75, finance and insurance $5.16, and business services $4.90. Articles quoting a $2.00 average are citing pre-2020 data.
Published SEO ROI figures range from 500% to 748% and from 8x to 12.2x, a spread wide enough to make the number useless as a forecast. The usable form is return on ad spend with a break-even date: First Page Sage's client data shows 11.10 for financial services, 8.75 for B2B SaaS and 3.65 for e-commerce, breaking even at 7 to 9 months. PPC returns less on average, near 200%, but it is measurable in week one.
Yes, but the direction depends on measurement. Within one dataset applying the same definition to both channels, organic converts better: First Page Sage records 2.4% for SEO against 1.3% for PPC across all industries. Compare across datasets and it flips, because WordStream's 8.18% counts conversions per ad click on lead-generation campaigns. Organic traffic represents users who have actively searched for relevant information, while paid traffic includes a mix of users with different intents — but never compare one source's conversion rate against another's.
Organic, once it works, and never before then. Terakeet found businesses acquire customers for 87.41% less on average through organic channels than paid media. The qualifier most comparisons omit: SEO has recurring costs in content, maintenance and links, so "no ongoing costs" is false. What SEO lacks is a cost per click, which is why its acquisition cost falls as the same pages keep ranking while a paid one stays flat.
Seven to nine months to break even on First Page Sage's sector data: 7 months for B2B SaaS, 9 for financial services and e-commerce. Before that, paid outperforms organic on every measure, because organic has produced almost nothing. Only about 5% of new pages reach the top 10 in their first year, which is why break-even is a range rather than a promise.
Google Ads first, if the business needs revenue inside a quarter: it produces traffic the same day and a knowable acquisition cost, which matters more than efficiency when runway is short. Start SEO in parallel at whatever budget survives, because the seven-to-nine-month break-even only starts counting once you begin — and at $8.67 a click, a legal firm's paid floor justifies funding organic from month one.
Who wrote it, what changed and how to tell us about a mistake.

Isabella Edwards
Technical SEO Content Manager, SEOmator
Leads technical SEO content at SEOmator: audits, Core Web Vitals and on-page fixes
Isabella Edwards leads technical SEO content at SEOmator, turning crawl data, Core Web Vitals, and on-page signals into guidance teams can actually act on. She focuses on the practical side of search — auditing sites, fixing what holds rankings back, and explaining the reasoning behind each recommendation so non-specialists can follow along.
Published · Updated
Spot a mistake or a number that has gone stale? Tell us. We correct it and log the change in the History above. Report an error →
SEOmator plans and pricing
Most of this cluster ends in the same question: what does the tooling cost? Here is every plan, side by side.
SEOmator plans and pricing· 8 min read
Learn how user experience (UX) influences SEO rankings, with key statistics and actionable best practices to improve site performance and engagement.

· 11 min read
Learn 9 proven methods to detect what CMS any website uses in 2026. Compare top tools like SEOmator, TechnologyChecker.io, Wappalyzer & BuiltWith with accuracy data and sales intelligence features.


